
Soybeans in September

HINT: This is NOT a love story.
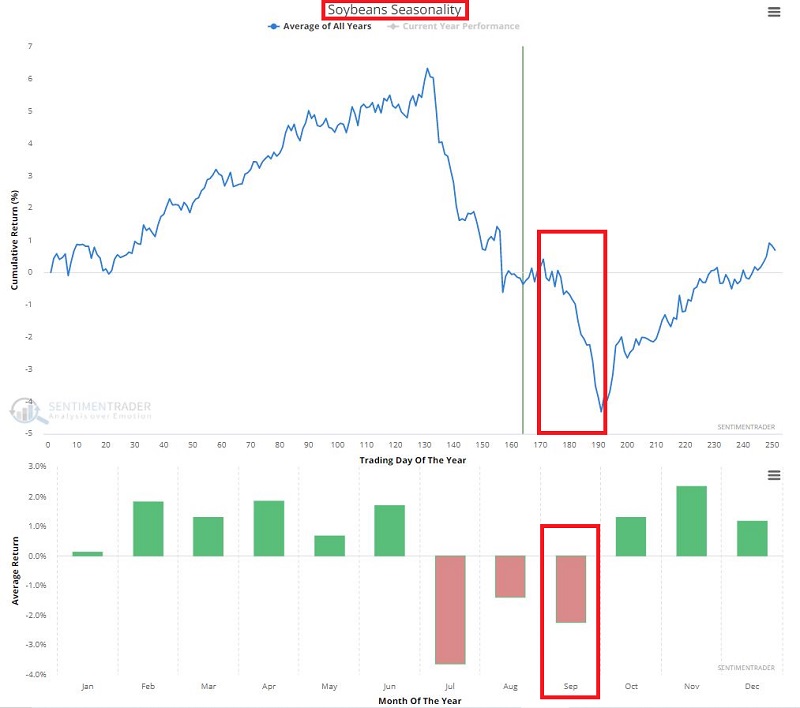
The chart below displays the Annual Seasonal Trend for soybeans in the top clip and the month-by-month Average Return in the bottom clip.
As you can in the chart above, on a solely seasonal basis, the period just ahead is a perilous one for soybeans as September is historically the 2nd worst month of the year.
So, does this mean that beans are doomed to plummet in the weeks ahead?
Ah, there's the rub. As I always point out, there is simply no way to know in advance if a given seasonal trend - even a very consistent and compelling one - is going to hold to form "this time around." Before talking about things from an actual trader's perspective, let's first review the historical performance.
SEPTEMBER INTO OCTOBER
The period I want to focus on extends from:
- The close on the last trading day of August
- The close on the 3rd trading day of October
So, for 2021, this equates to the close on 8/31/2021 through the close on 10/5/2021.
The chart below displays:
- $ gain or loss for a long position in soybean futures
- From September Trading Day of Month #1 (TDM #1)
- Through October Trading Day of Month #3 (TDM #3)
- Every year since 1960
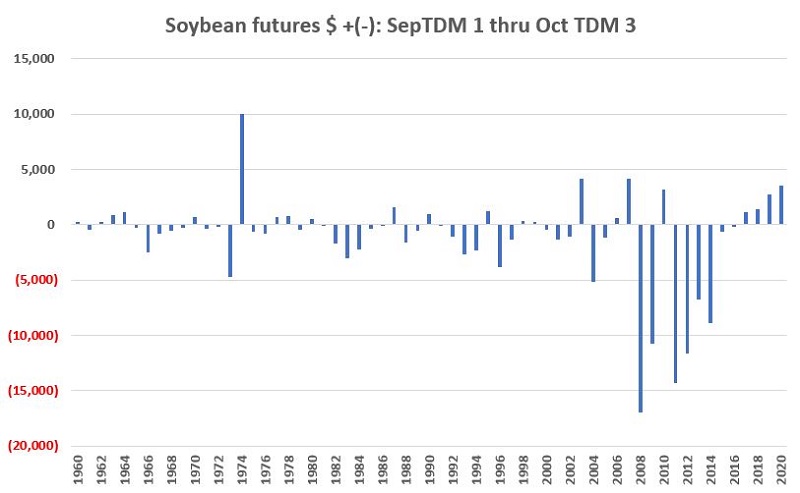
Things to Note:
- Soybeans showed a gain during this period 22 times (36% of the time)
- Soybeans showed a loss during this period 39 times (64% of the time)
- There were a series of significantly large declines between 2008 and 2014
- However, the last 4 years in a row have seen beans advance during this purportedly "Unfavorable" period
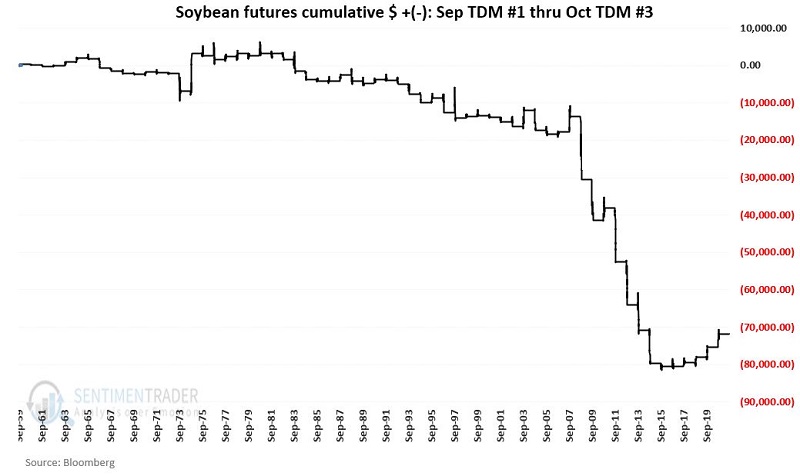
The chart below displays the cumulative $ + (-) for soybeans during the Sep-Oct period in question.
FROM A TRADER'S PERSPECTIVE
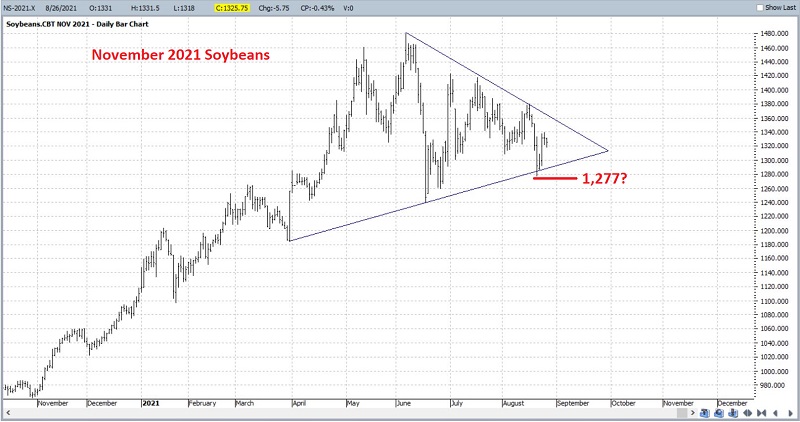
It is important to point out that Sentimentrader does NOT dispense specific investment or trading advice. However, one of our educational objectives is to teach individuals to better "think like a trader." So solely for the purpose of illustrating some of the decisions that need to be made, I have arbitrarily drawn:
- A narrowing channel (ostensibly - and again, arbitrarily - connecting several lower highs and higher lows)
- A potential support level just outside the channel at 1,277
A futures trader who anticipates that the 4-year winning streak during the unfavorable Sep-Oct period will be broken and wishes to play the short side of beans must answer the following two questions:
Question #1. When and where should I sell short?
- One possibility is to sell short at the close on 8/31 (i.e., the start of the "unfavorable" period)
- Another possibility is to wait for a breakdown below a support level (ex., $1277) as confirmation that a downtrend is beginning
- Other traders may incorporate their favorite technical indicators to attempt to identify an optimal time to enter a short position within the seasonally "unfavorable" window
Question #2. How much money am I willing to risk?
This is really the area that ultimately separates long-term winners from users. Let's consider an example answer. Assume that a trader:
- Has a $100K trading account
- Is willing to risk 3% of capital on a soybean trade
- Has decided to sell short 1 soybean futures contract at 1,277
Let's do some math.
- Each one full point movement for soybean futures is worth $50
- If a trader is willing to risk $3,000 on a 1-lot, then their stop loss must be placed 60 points above their short entry price ($3,000 / $50 per point = 60 points)
- So, if this trader sells short at 1,277, then their stop-loss should be placed no higher than 1,337 (1,277 + 60)
- A glance at the bar chart above of November soybeans alerts us to the fact that - in the whole big spectrum of things - a 60-point movement is not all that large for this contract at its current price
The bottom line: The trader must have significant confidence that the expected down move in beans will occur BEFORE entering a trade.