
Something may finally be stirring with gold and gold stocks

Key Points
- Gold Optix recently hit a level that has seen a high percentage of up moves in the past
- A relationship that may raise eyebrows is the one between bond volatility and gold stocks
Gold Optix
Few markets have disappointed investors more than gold so far in 2022. While gold has held up better than stocks and bonds, the performance in the face of soaring inflation was dismal. After decades of being touted as a "strong hedge against inflation," gold did little as inflation soared past 9%. And of course, human nature being what it is, traders finally threw in the towel on gold recently.
Which seems like a good time to invoke:
Jay's Trading Maxim #306: Human nature can be a detriment to trading success and should be avoided as much as humanly possible.
Just saying.
The chart below displays ticker GLD (SPDR Gold Shares) and the 5-day average for GLD Optix. The red dots represent those times when the indicator was below 15%.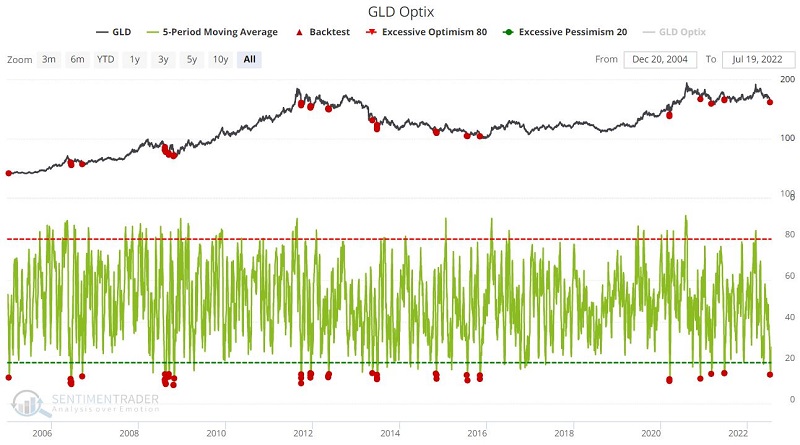
The table below displays GLD performance following previous signals. The two-and-six month time frames have previously shown the highest Win Rate. The latest signal occurred on 7/11/2022.
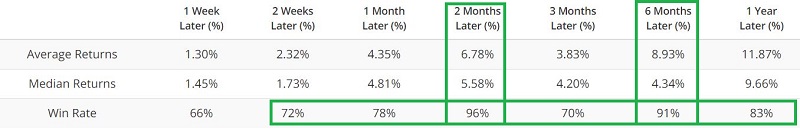
Gold Stocks versus Bond MOVE Index
Ticker HUI is the ticker for the "Gold Bugs Index," an index that tracks various gold mining stocks. The Bond MOVE Index is essentially the "VIX Index" for bonds and tracks the implied volatility of options on treasury bond futures.
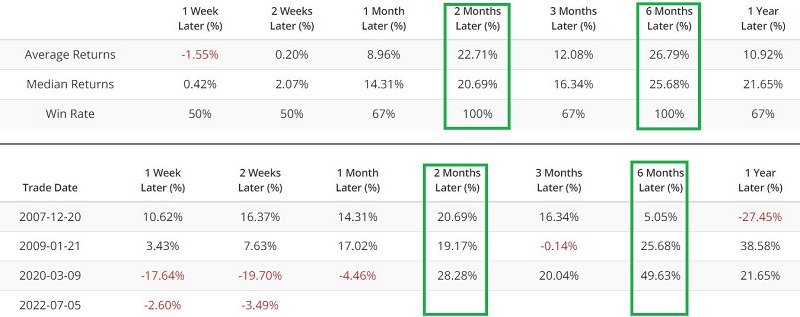
Can these two possibly have a relationship of any kind? Well, under the category of "We report, you decide" (as opposed to the standard media mantra of "We decide, then we report our decision to you"), the chart below displays HUI and those times when the Bond MOVE Index has crossed above 150 for the first time in 12 months. The latest signal occurred on 7/5/2022.
The table below displays the performance for HUI following previous signals.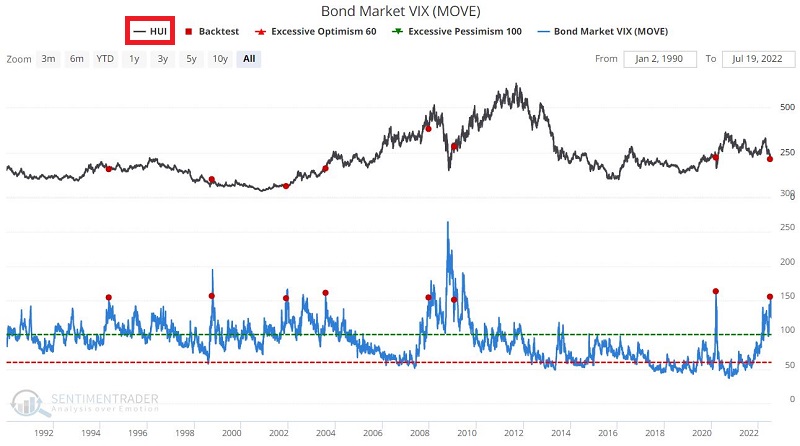
Two-and-six month periods showed some robust returns - although the 1998 signal was a bust and the 2020 signal witnessed a -20% drop in the first week before a massive rebound.
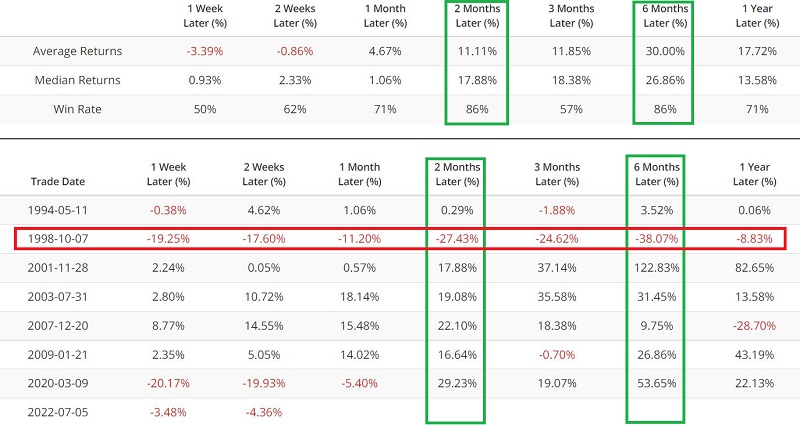
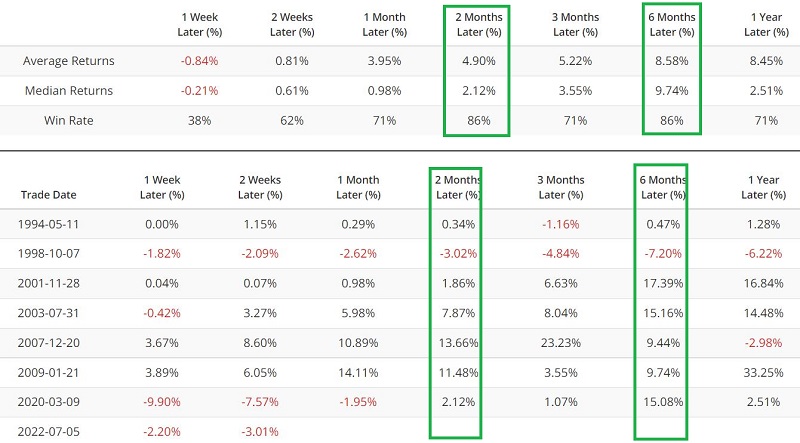
The chart and table below use ticker GDX (VanEck Gold Miners ETF) - an actual tradable ETF - instead of HUI.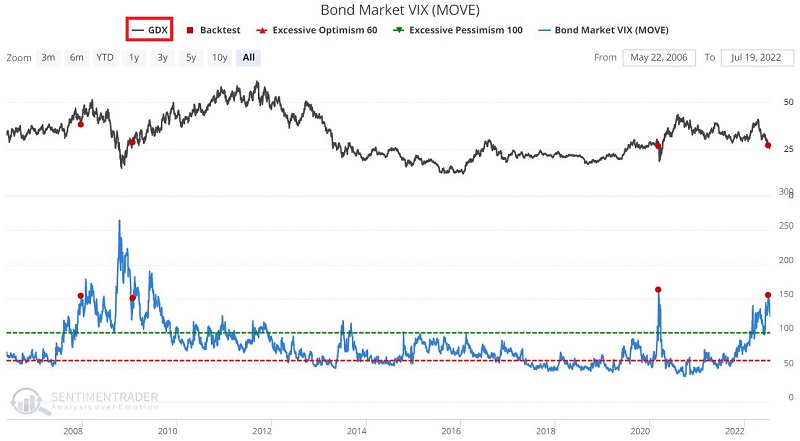
Here too, two- and six-month returns were noteworthy.
Lastly, the table below displays a summary of gold (the metal) performance following previous signals. Once again, the two- and six-month periods show a high Win Rate - although absolute returns were far less robust than those for gold stocks.
One additional factor to consider: In this piece, I noted that gold had entered a seasonally favorable time of year, as seen in the chart below.
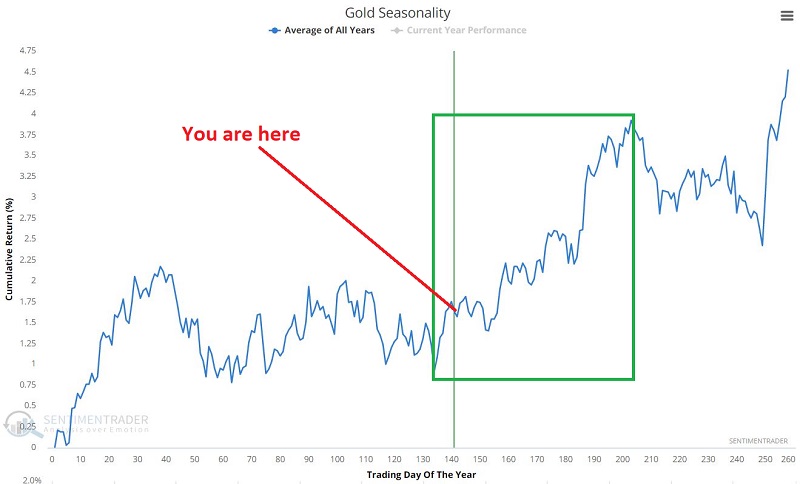
Seasonality should rarely be relied upon as a standalone indicator when deciding what to trade. But when it confirms other signals, it can be beneficial in spotting good opportunities.
What the research tells us…
Gold and gold stocks have significantly disappointed during this period of high inflation. Concurrently, investor sentiment has recently plunged. Many factors influence the price of gold and gold stocks, and they could easily continue to be laggards. Nevertheless, the signals above suggest that something may finally be stirring in gold and gold mining stocks. If they are going to make a favorable move in 2022, it may be "soon or never."