Data &
Technology
Research
Reports
Report Solutions
Reports Library
Actionable
Strategies
Free
Resources
Simple Backtest Calculator
Simple Seasonality Calculator
The Kelly Criterion Calculator
Sentiment Geo Map
Public Research Reports
Free Webinar
Pricing
Company
About
Meet Our Team
In the News
Testimonials
Client Success Stories
Contact
Log inLoginSign up
< BACK TO ALL REPORTS

Some factors to consider as we start the new week

Troy Bombardia
2020-06-21
The coronavirus-driven recession pushed oil down to previously unthinkable lows. It's been almost 3 months since stocks bottomed in late-March, and tech stocks have surged

Here are some things I'm looking at as we start the new week.

Crude oil

The coronavirus-driven recession pushed oil down to previously unthinkable lows. Crude oil's term structure was at record lows, implying that traders were betting on a rebound in oil. And rebound it has. While still not back up to pre-COVID levels, oil is much higher than it was during the global lockdowns.

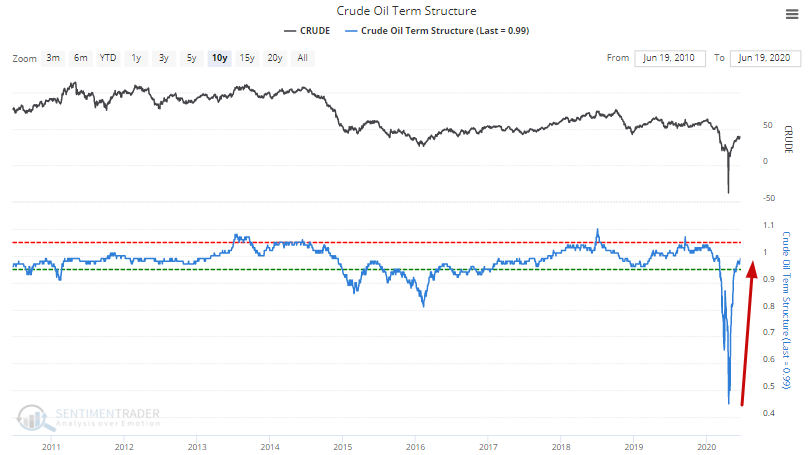
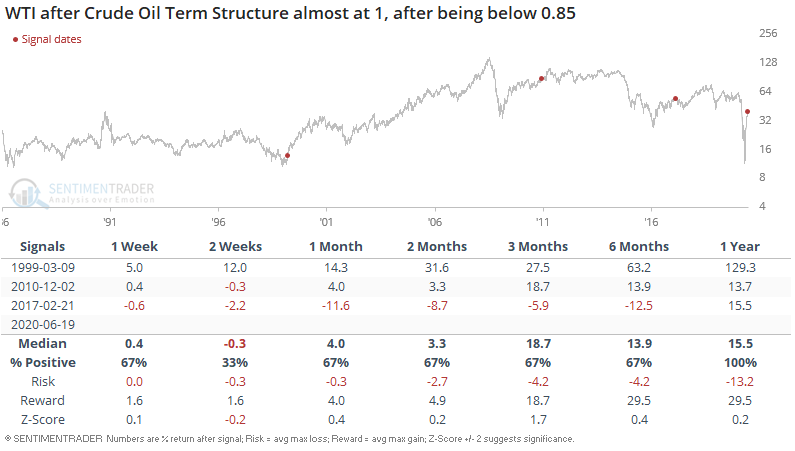
When crude oil's term structure almost climbed back up to 1 after falling below 0.85, oil climbed further over the next year, even if it made a short term pullback:

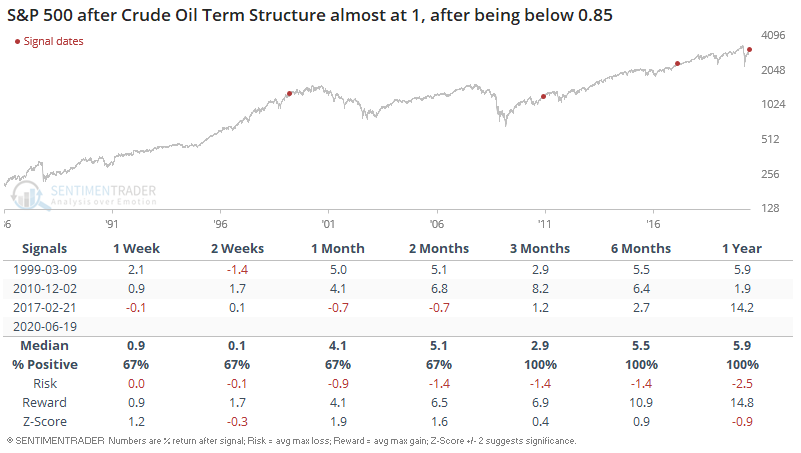
Since rapid declines in oil prices are often accompanied by a deterioration in the global economy, rising oil prices (accompanied by an improving global economy) also usually led to more gains for stocks over the next 6-12 months:

Momentum & volatility

It's been almost 3 months since stocks bottomed in late-March, and tech stocks have surged. The NASDAQ Composite's 3 month rate-of-change is at its highest level in over a decade. And just when it seemed like tech stocks were poised to pullback last week, the NASDAQ rallied 6 months in a row.

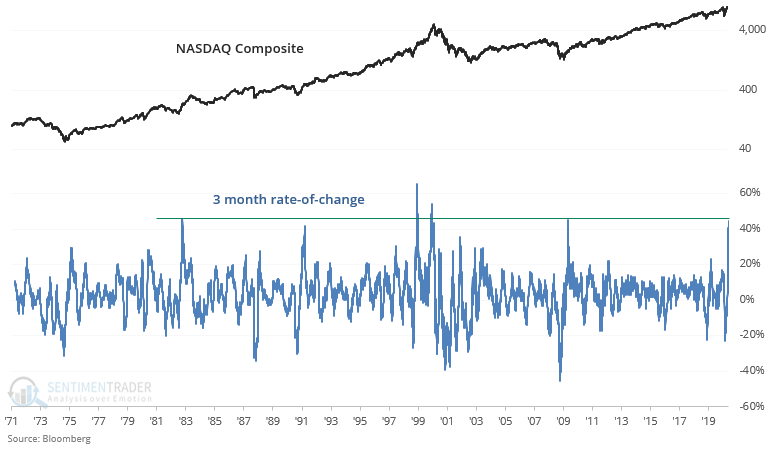
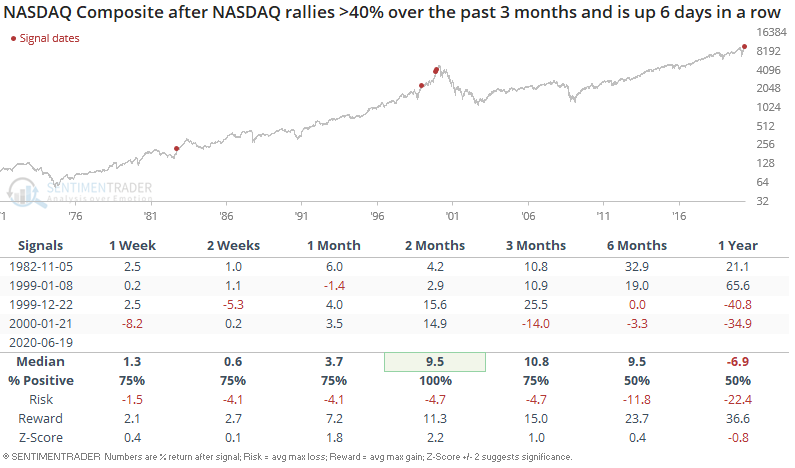
It's extremely rare for the NASDAQ Composite to rally >40% over the past 3 months and go up 6 days in a row. When this happened in the past, it wasn't a consistently short term bearish factor for the NASDAQ. Animal spirits can easily swamp any short term extremes:

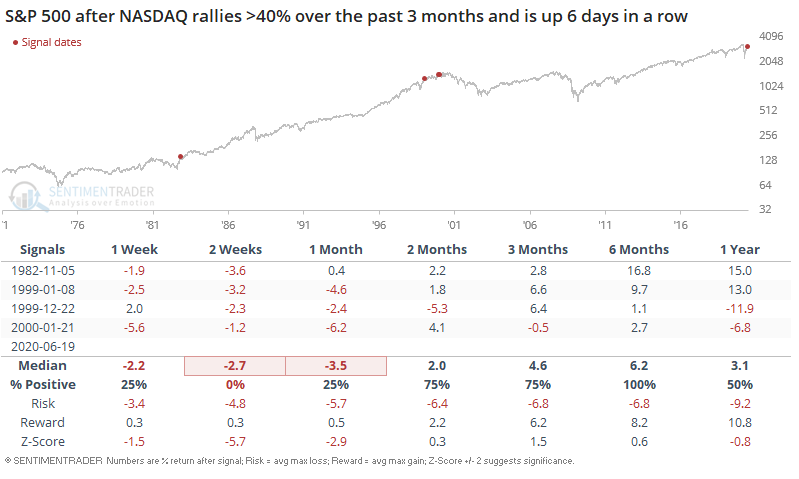
But as for the S&P 500, this consistently led to pullbacks over the next 2 weeks:

Trading has been somewhat muted this week after last week's 1 day crash.

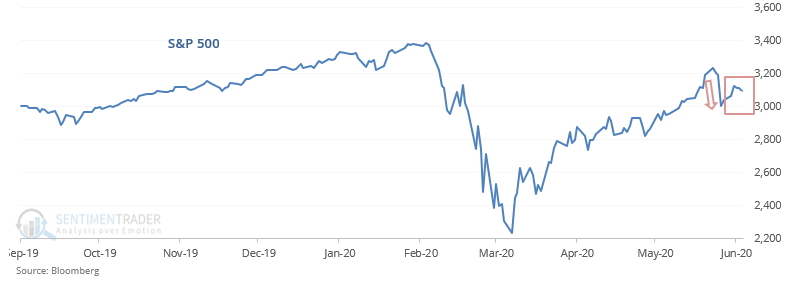
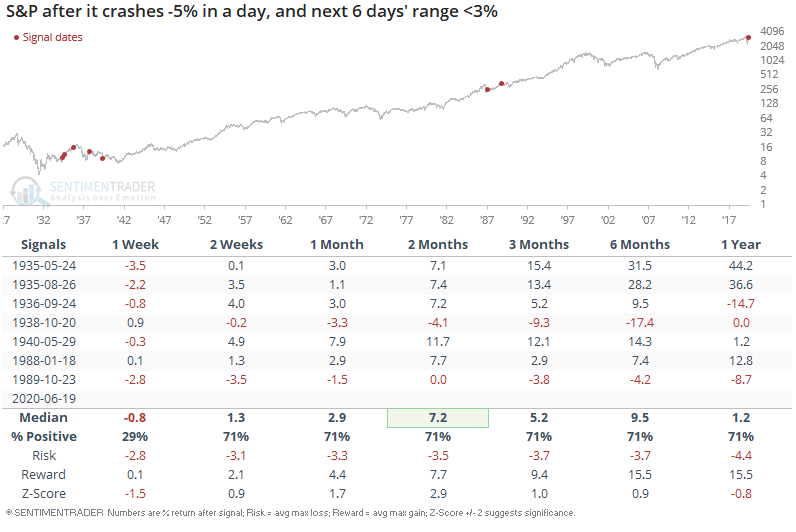
The S&P crashed more than 5% in one day last week, and then the next 6 days saw the highest close price exceed the lowest close price by no more than 3%. When a big one day crash was followed by a small trading range, the S&P usually fell over the next week:

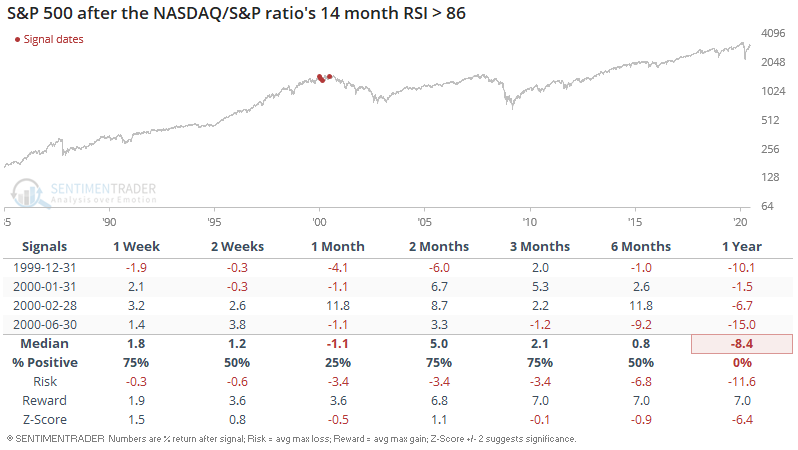
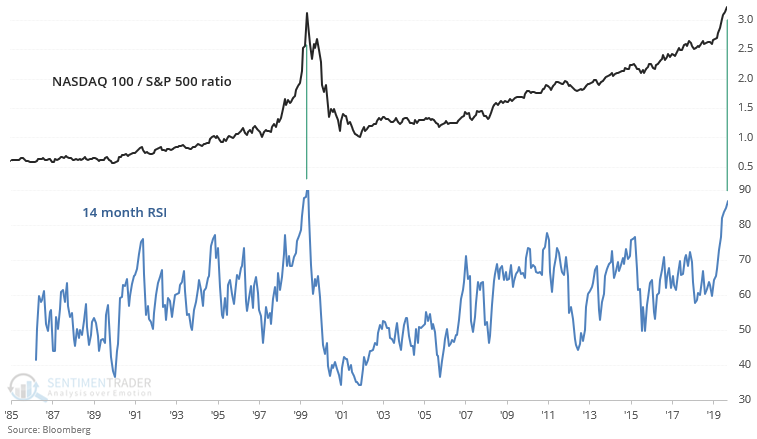
The NASDAQ 100 / S&P 500 ratio is registering 2 extremes at the same time:

  1. The ratio itself is higher than where it was at the top of the dot-com bubble.
  2. The ratio's 14 month RSI can only be matched by 3 other months from December 1999-February 2000:

Needless to say, those dates were not good for long term investors who bought tech stocks:

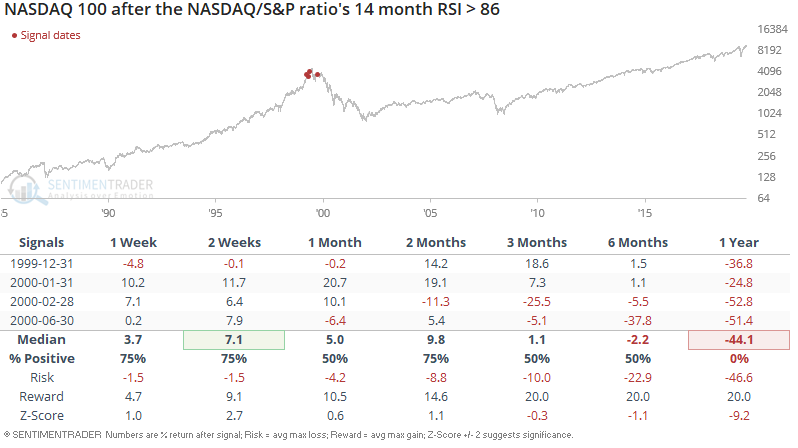
Or for long term investors who bought U.S. stocks in general:

Sorry, you don't have access to this report

Upgrade your subscription plan to get access
Go to Dasboard
DATA &
TECHnologies
IndicatorEdge
‍
BackTestEdge
‍
Other Tools
‍
DataEdge API
RESEARCH
reports
Research Solution
‍
Reports Library
‍
actionable
Strategies
Trading Strategies
‍
Smart Stock Scanner
‍
FREE
RESOUrCES
Simple Backtest
Calculator
Simple Seasonality
Calculator
The Kelly Criterion
Calculator
Sentiment Geo Map
‍
Public Research Reports
‍
Free Webinar
COMPANY
‍
About
‍
Meet our Team
‍
In the News
‍
Testimonials
‍
Client Success Stories
Pricing
Bundle pricing
‍
Announcements
‍
FAQ
© 2024 Sundial Capital Research Inc. All rights reserved.
Setsail Marketing
TermsPrivacyAffiliate Program
Risk Disclosure: Futures and forex trading contains substantial risk and is not for every investor. An investor could potentially lose all or more than the initial investment. Risk capital is money that can be lost without jeopardizing ones’ financial security or life style. Only risk capital should be used for trading and only those with sufficient risk capital should consider trading. Past performance is not necessarily indicative of future results.

Hypothetical Performance Disclosure: Hypothetical performance results have many inherent limitations, some of which are described below. No representation is being made that any account will or is likely to achieve profits or losses similar to those shown; in fact, there are frequently sharp differences between hypothetical performance results and the actual results subsequently achieved by any particular trading program. One of the limitations of hypothetical performance results is that they are generally prepared with the benefit of hindsight. In addition, hypothetical trading does not involve financial risk, and no hypothetical trading record can completely account for the impact of financial risk of actual trading. for example, the ability to withstand losses or to adhere to a particular trading program in spite of trading losses are material points which can also adversely affect actual trading results. There are numerous other factors related to the markets in general or to the implementation of any specific trading program which cannot be fully accounted for in the preparation of hypothetical performance results and all which can adversely affect trading results.

Testimonial Disclosure: Testimonials appearing on this website may not be representative of other clients or customers and is not a guarantee of future performance or success.