
Smart Money Index: Everything You Should Know
The Smart Money Index (SMI), also known as the Smart Money Flow Index, is a technical indicator which tries to gauge what the "smart money" is doing vs. what the "dumb money" is doing in the U.S. stock market. It suggests that investors and traders should follow the "smart money" instead of the "dumb money". In this post you'll learn about:
- What is the Smart Money Index
- How is this indicator calculated
- How to use the Smart Money Index
- Does the Smart Money Index actually work? If not, why not?
- Where can you get regular updates for this indicator?
What is the Smart Money Index (a.k.a. Smart Money Flow Index)
The Smart Money Index, or Smart Money Flow Index, was popularized by Don Hayes in the 1990s and seeks to understand what the "smart money" is doing relative to the "dumb money". This indicator exists in different variations, but is based on the same concept:
- The “dumb money” trades at the start of the day since they're emotionally reacting to the overnight or early morning news. Trading on the news is not a smart thing to do. Meanwhile...
- The "smart money" trades during the last hour of each trading day since they spend the day evaluating the market's price action.
As a result of this concept, the Smart Money Index states that savvy investors and traders should bet on the stock market's direction towards the end of the day since that is what the "smart money" is doing, and bet against the stock market's direction at the start of the day since that is what the "dumb money" is doing.
How is this indicator calculated?
So how exactly is the Smart Money Flow Indicator calculated? What counts as "start of the day" and what counts as "end of the day?
- Calculate the S&P 500's nominal gain or loss during the first half hour of trading (9:30 a.m. - 10 a.m.)
- Calculate the S&P 500's nominal gain or loss during the last hour of trading (3 p.m. - 4 p.m.)
- Today's Smart Money Index = yesterday's Smart Money Index - the market's gain/loss in the first half hour of trading today + the market's gain/loss in the last hour of trading today.
Here's an example. Let's assume that the Smart Money Index's value yesterday was 5,000. The S&P lost -14 points this morning and gained +8 points this afternoon. The Smart Money Index's latest value is now 5000 - (-14) + (+8) = 5022.
Here's another example. Let's assume that the Smart Money Index's value yesterday was 5,000. The S&P rallied +9 points this morning, and gained +7 points this afternoon. The Smart Money Index's latest value is now 5000 - 9 + 7 = 4998.
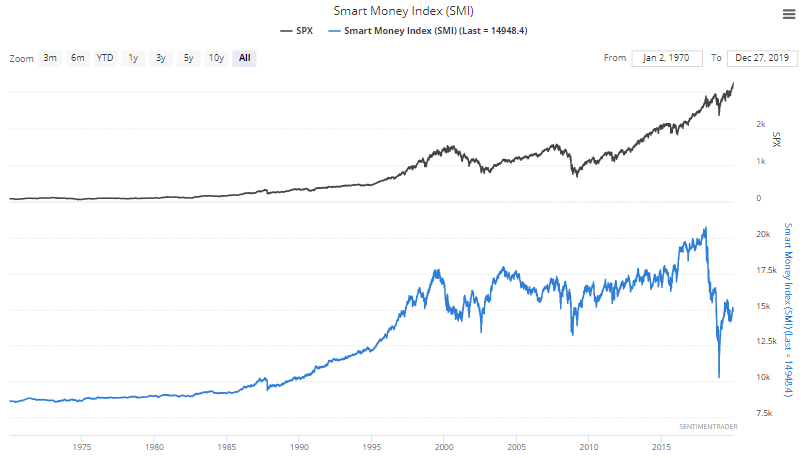
The Smart Money Flow Index can be calculated for any stock market index. The one that's frequently quoted in mainstream media is for the Dow Jones Industrial Average. But since the S&P 500 is a better representation of the overall U.S. stock market, we have calculated the SMI for the S&P 500. Here's what this indicator looks like:
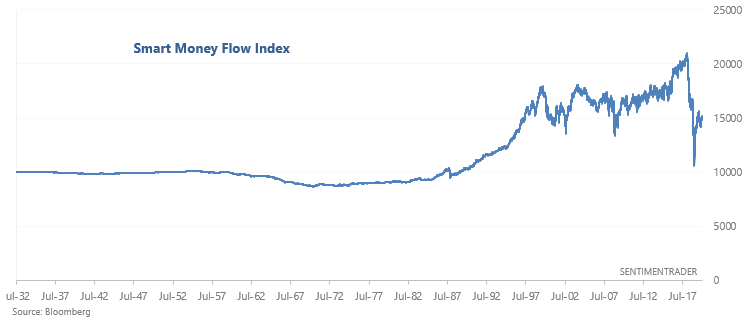
If you have a Bloomberg Terminal, you can find this indicator going back to the 1930s for the Dow Jones Industrial Average.
How to use the Smart Money Index
There is no hard-and-fast rule for how to use the SMI. There is no exact point in which we can say "the Smart Money Index is bullish for stocks right now" or "the SMI is bearish for stocks right now". With that being said, traders generally use this indicator to "confirm" the stock market's trend or look for "divergences".
Confirming the trend
If the market moves in the same overall direction as the SMI, then the SMI is "confirming" the stock market's direction, which suggests that the trend will continue.
- If the U.S. stock market rallies and the Smart Money Flow Index trends higher at the same time, that’s seen as a bullish sign of “smart money confirmation”.
- If the U.S. stock market falls and the Smart Money Flow Index trends lower at the same time, that’s seen as a bearish sign of “smart money confirmation”.
Divergence
If the market trends in a different direction than the SMI, then the stock market will eventually mean-revert to the SMI’s direction. This means that...
- If the stock market goes down but the Smart Money Flow Index trends higher ("smart money is more bullish relative to dumb money"), that’s seen as a “bullish divergence” for the stock market. Theory states that the stock market will probably go higher soon.
- If the stock market goes up but the Smart Money Flow Index trends down ("smart money is more bearish relative to dumb money"), that’s seen as a “bearish divergence” for the stock market. Theory states that the stock market will probably go lower soon.
Between these 2 uses, traders more commonly look for "divergences" since divergences can help traders predict major turning points in the market. "Bearish divergences" are usually more common than "bullish divergences" for this indicator.
Does the Smart Money Index actually work?
How useful is the Smart Money Flow Index? Does it actually work, or is it just another one of those indicators' whose logic "sounds" really smart but in real-time is not much better than a 50/50 coin toss?
It's hard to quantitatively test this indicator to see if it works, since the term "divergence" is hard to quantify. No 2 traders staring at a chart will define a "divergence" the exact same way. (This is why I prefer quantitative trading over discretionary trading - it clears up ambiguity).
Since the most common use is to look "bearish divergences", let's see if the Smart Money Index's "bearish divergences" with the S&P 500 were able to predict major historical market tops.
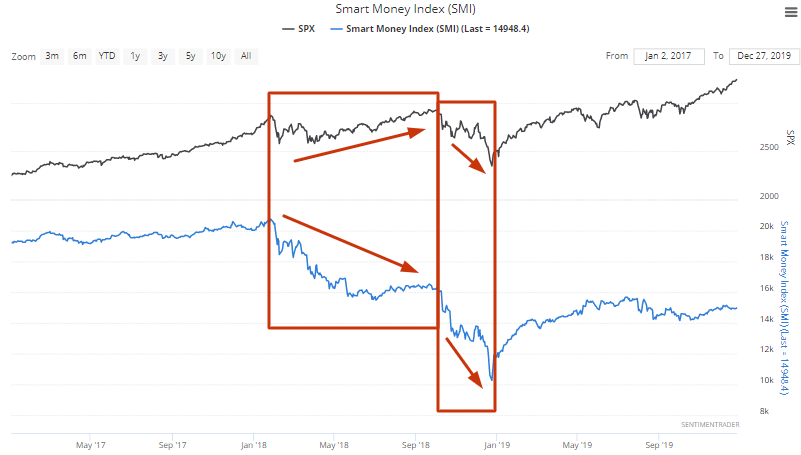
2018 stock market crash
While the U.S. stock market was trending higher from Q1-Q3 2018, the Smart Money Index was trending lower. This was followed by a stock market crash in Q4 2018. In a sense, this did warn of the impending stock market crash.
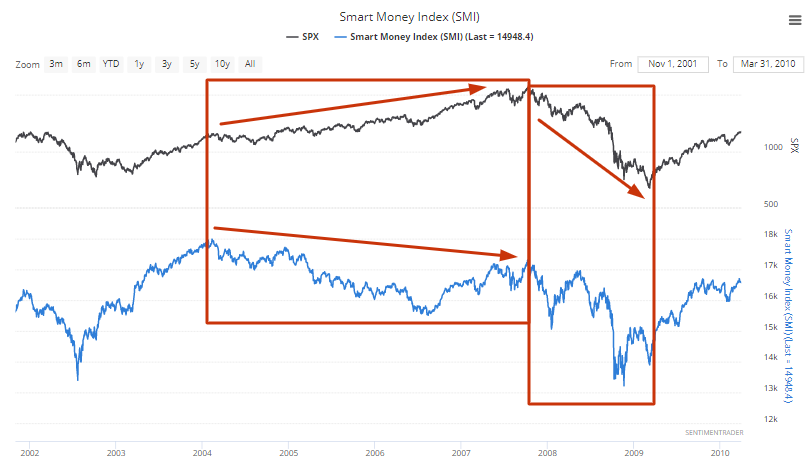
October 2007 bull market top
The U.S. stock market peaked in October 2007, but the Smart Money Index peaked more than 3.5 years earlier in February 2004. This was not a very useful warning sign for the U.S. stock market. When an indicator has been saying "BEARISH DIVERGENCE" for 3.5 years, it isn't very useful for market timing because it encourages the trader to turn bearish too early. Being too early isn't a whole lot different from being too late.
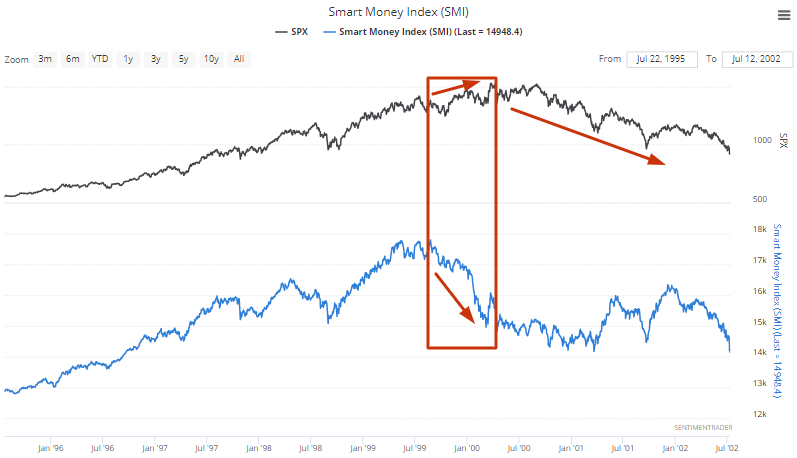
March 2000 bull market top
The U.S. stock market made a flat top from March - August 2000. Meanwhile, the Smart Money Index peaked in August 1999 and had collapsed by March 2000 (bearish divergence). Overall, this was an effective timing indicator for predicting the stock market's top.
January 1973 bull market top and 1973-1974 bear market
The U.S. stock market peaked in January 1973, and began a massive bear market that lasted until October 1974. The Smart Money Index's direction was very interesting during this period.
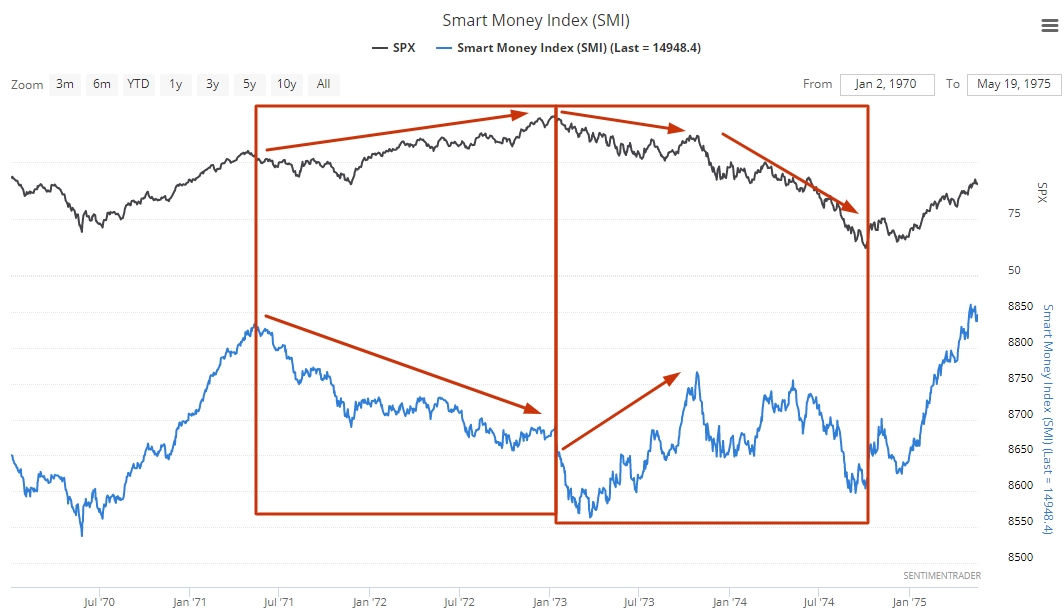
The Smart Money Index trended lower from the 2nd half of 1971 - 1972 as stocks trended higher. This was a decently useful "bearish divergence" since the U.S. stock market made a major peak in January 1973. But then something interesting happened. While the U.S. stock market trended downwards from January - October 1973, the Smart Money Index trended higher! This formed a "bullish divergence", which suggests that the stock market should rally soon.
Nothing could be further from the truth. Stocks CRASHED from October 1973 - October 1974. The bullish divergence failed.
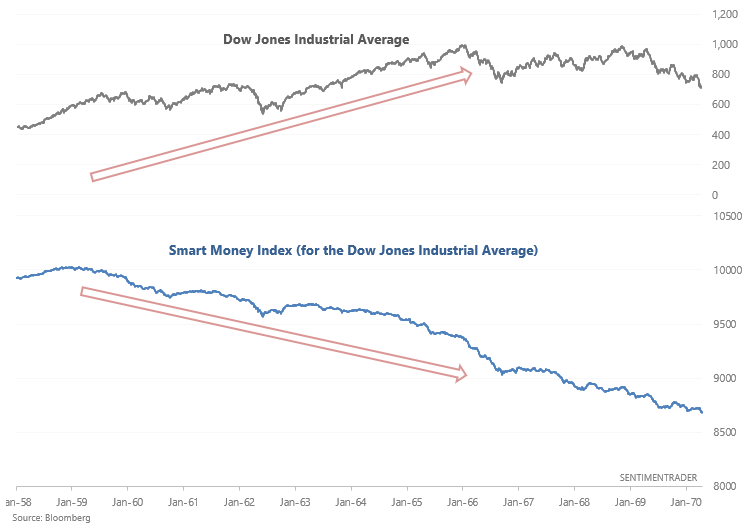
1960s
And lastly, here's a "bearish divergence" from the 1950s and 1960s. While the Dow Jones Industrial Average trended higher from the late-1950s to mid-1960s, the Smart Money Index trended downwards for 7 years. A "bearish divergence" that lasts for 7 years isn't very useful for market timing.
Conclusion
The Smart Money Index's historical track record is mixed, and it isn't clear that its track record is much different from a 50/50 coin toss. This is the case with many popular indicators which have a "smart sounding name" and "smart sounding logic", but when you add up the successes + failures aren't much better than a coin toss. This indicator did succeed in calling major market tops sometimes. But it also failed spectacularly at other times. Even a monkey throwing darts at a chart will be right 50% of the time. Focusing on the successes & sweeping failures under the rug doesn't do justice to actual traders and investors.
There are many indicators like this - popular indicators that have a mixed track record of success. Examples include MACD, stochastics, moving averages, etc. They sometimes work and sometimes fail. Popular indicators aren't always the best ones - they're just the most popular (i.e. the most marketed indicators).
Since I have a significant chunk of my net worth in my trading account (skin in the game) and this indicator does not have a great track record, I do not use this for my own trading.
What's wrong with the Smart Money Index? Why doesn't it work as it claims to?
It's hard to say exactly why an indicator works or doesn't work, but there are some clear flaws with this indicator's logic. For starters:
- It's not true that the "smart money" trades at the end of the day.
- It's not true that the "dumb money" trades at the start of the day.
Anecdotally, I know many very successful traders who only execute trades at the daily open. But from a data-driven perspective, the last hour of each day (when the "smart money" supposedly trades, according to this indicator) always sees a spike in volume.
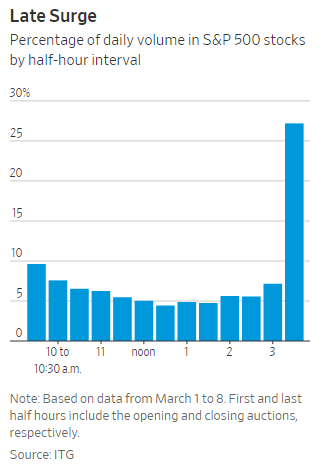
Over the past 15 years, more and more volume has occurred near the daily close due to the rising popularity of ETFs. ETFs often recalibrate their components and buy/sell each near the closing bell. And since everyone trades ETFs nowadays (mom and pop, professional traders, hedge funds, etc), it's hard to make the argument that the last hour of trading is frequented by only the "smart money".
In fact, the Wall Street Journal demonstrated that more than a quarter of daily volume in the S&P 500 stocks occur in the last half hour of each trading day (3:30 - 4 pm). The shift towards late-day trading has surged in recent years.
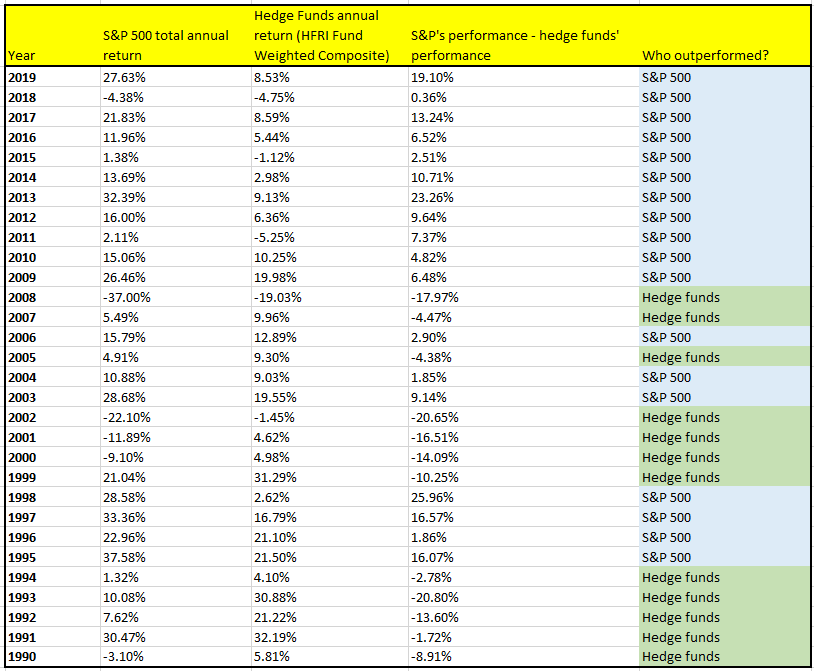
Moreover, this indicator doesn't really describe who the "smart money" is. Contrarians? Hedge funds? Institutional investors? If one thing's for sure, it's that the boundary between "smart money" and "dumb money" (in terms of whose performance is better) has blurred over the past 10 years. For example, the past 10 years have seen the average hedge fund consistently underperform "dumb" mom and pop who just buys and holds.
Where can you get regular updates for the Smart Money Index?
If you want to get daily updates for the Smart Money Index (SMI, aka Smart Money Flow Index), you can calculate it by hand or access it in your Bloomberg Terminal. Calculating it by hand is tedious and most traders don't have a Bloomberg Terminal. Alternatively, we update this indicator every day for our subscribers. Please go here to learn more.