
Smart Money / Dumb Money flashes a signal (and what to do about it, if anything)

Key Points
- Our Smart Money / Dumb Money Confidence Spread recently reached the upper decile (highest 10%) of historical readings
- Historically this occurrence has potential implications for both investors and traders
An important sentiment reading
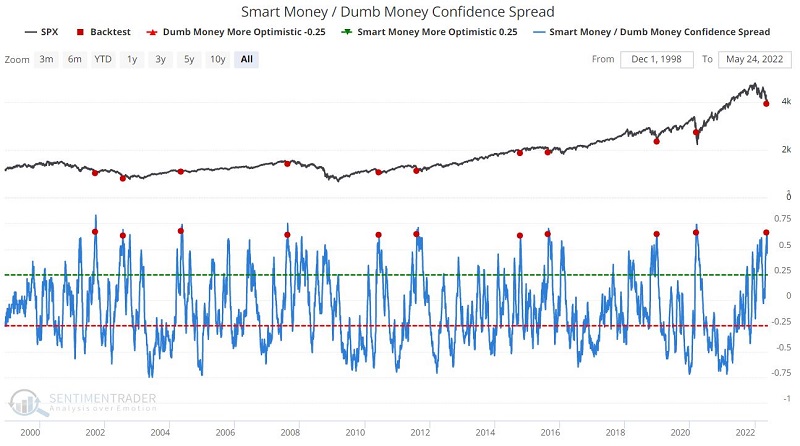
Our Smart Money / Dumb Money Confidence Spread (SMDM) recently reached the upper decile of historical readings by crossing above 0.63. The chart below displays when SMDM crossed above 0.63 for the first time in three months. A reading of this level can only occur when Smart Money is quite confident and Dumb Money is extremely pessimistic.
The table below displays a summary of SPX performance following these signals.
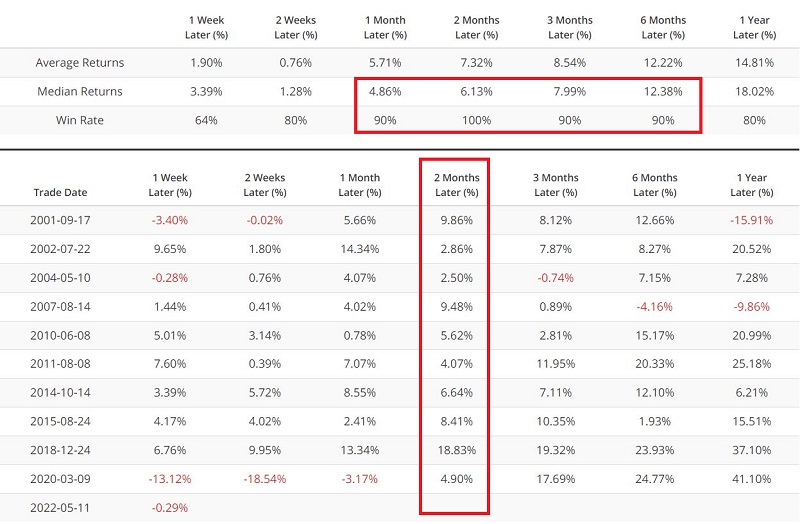
The critical thing to note is the high Win Rates across multiple time frames. This suggests that at least a temporary market rebound may be in the offing (although it remains possible that things will get worse before they get better).
From an investor's perspective
A longer-term investor should view this SMDM signal as an "alert" that we may be entering a favorable period to put available cash to work in the stock market. The key decision is:
- To use this signal as an automatic "trigger" to act, OR
- As an "alert" to watch for signs of a reversal before acting, i.e., to wait for some actual price movement confirmation
There are no correct answers, only decisions to be made and enough resolve to act when the time comes. This reminds me of one of my favorite phrases:
"When the time comes to buy, you won't want to." Walter Deemer
One other point: If you are a longer-term investor fully invested when the SMDM signal occurs, the signal is merely added to the "Weight of the Evidence" that suggests that now is not the time to panic sell - even if the market heads lower in the interim.
From a trader's perspective
Another approach is to use it as a shorter-term trading signal. Let's consider a practical application to the numbers above. Let's assume that we will plan to hold an SPX index fund for two months after each signal. The key questions are:
- How much can we expect to make?
- How much risk can we expect to take?
The table below provides some answers. The "Max. Drawdown %" column displays the worst % decline from the S&P 500 close on the day of the signal and the subsequent low. The "# Days to Low" column indicates how many trading days it took to reach the Maximum Drawdown shown in the previous column.
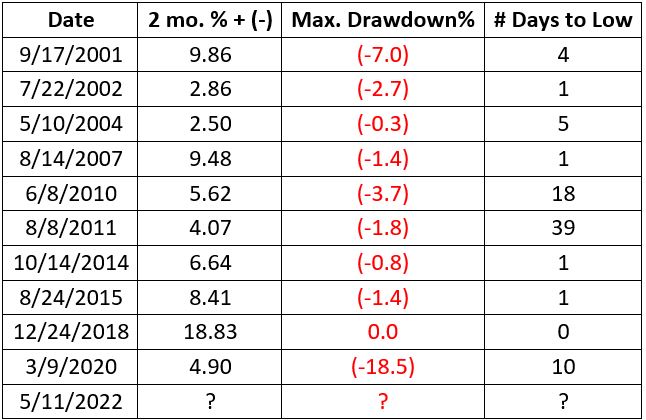
In some cases, the drawdowns were relatively small; in others, they were fairly substantial.
Two key decisions:
- What portion of capital to allocate?
- How much risk to take before cutting a loss?
Once again, there are no correct answers - only answers that fit your own trading style and risk tolerance. The responses below are hypothetical and meant as food for thought.
One hypothetical trading plan: Since signals rarely come, I would allocate up to 10% of my capital (tapping the "Whatever" portion of the portfolio - see here). Because I am only allocating a maximum of 10% of my total portfolio, I am not as concerned about drawdown. A 20% drawdown would mean a -2% decline in the overall portfolio. As a result, I will NOT to use a stop-loss order and will hold the index fund for 42 trading days and bank my gain or loss at that point.
The chart below displays the cumulative % return from holding for two months after every signal.
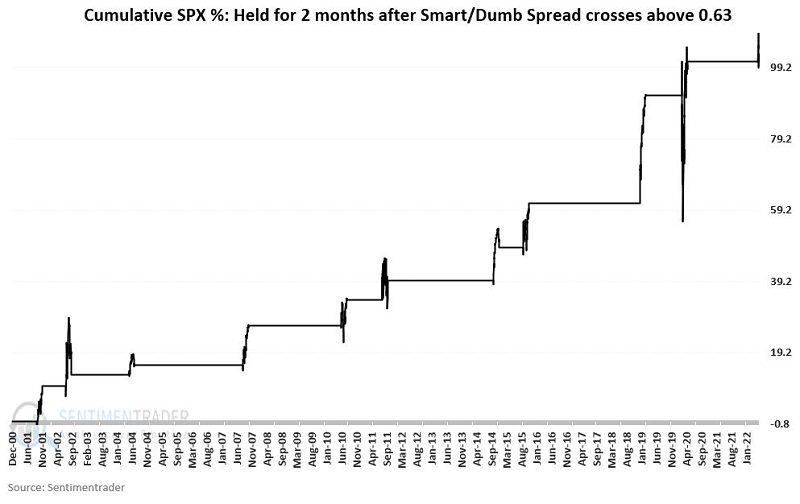
Has this been profitable? Yes
Is it without risk? No
Have there been some sizably volatile swings along the way? You bet
Is this tradable? That's up to each trader to decide for themselves
What the research tells us...
Higher stock prices have consistently followed the signals described above over many years. There are, however, never any guarantees that the "next one" will follow suit. It is up to you and you alone to decide if you will use the signals and how.
If you use it to add cash to the market, will you act when the signal occurs? Or will you wait for some form of confirmation (Important: If you are going to wait for confirmation, you must identify exactly what indicators or type of market action will constitute "confirmation" - and you must resolve to act decisively if and when that confirmation comes.
If you plan to use it as a shorter-term trader, you must make some serious decisions regarding allocation size and whether or not to use a stop-loss - and if so, how large of a stop-loss to use.