Products
SentimenTrader Trading Tools
‍
Backtest Engine
My Trading Toolkit
Correlation Analysis
Seasonality
Indicators & Data API
‍
Proprietary Indicators & Charts
Market Data API
Strategies & Scanner
‍
50+ Trading Strategies
Smart Stock Scanner
Research Reports
‍
Research Solutions
Reports Library
Free Resources
Simple Backtest Calculator
Simple Seasonality Calculator
The Kelly Criterion Calculator
Sentiment Geo Map
Public Research Reports
Pricing
Company
About
In the News
Testimonials
Client Success Stories
Contact
Log inLoginSign up
< BACK TO ALL REPORTS

Smart Money / Dumb Money Confidence Spread reaches another threshold

Jay Kaeppel
2022-03-11
The Smart Money / Dumb Money Confidence Spread has actually been widening since early January, and several useful thresholds have already been hit. Now another of the more useful iterations of this indicator has triggered. Herein we detail what this may mean for stocks in the months ahead.

Key Points

  • When our Smart Money / Dumb Money Confidence reaches a positive extreme, it typically portends good things for stocks
  • There is no "one best way" to designate the spread as "extreme," but there are several thresholds that have proven useful (see here and here)
  • Another one of the more useful measures of an extreme in sentiment using this indicator just triggered a new signal

The 21-day moving average

The chart below displays each time the 20-day average for the Smart Money / Dumb Money Confidence Spread crossed above 0.45 for the first time in 21 days. You can run this test in the Backtest Engine.

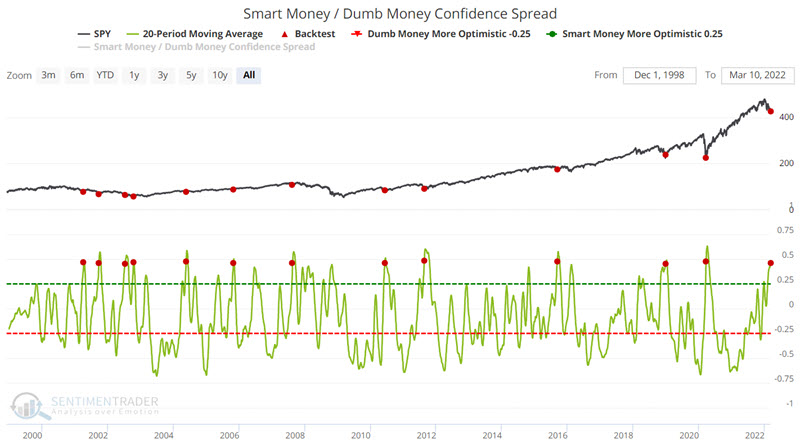
The latest signal was triggered on 3/10/2022.

The table below displays a summary of SPY (iShares S&P 500 Trust ETF) performance results following previous signals.

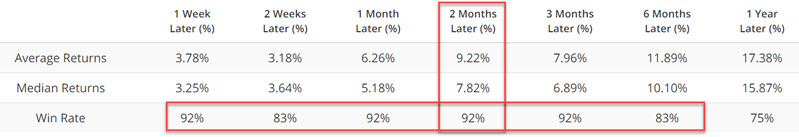
Note the consistently high Win Rates across all time frames. Of particular note is the performance during the two months after a signal (92% Win Rate, Average gain over 9.2%, and worst loss of -1.26%). 

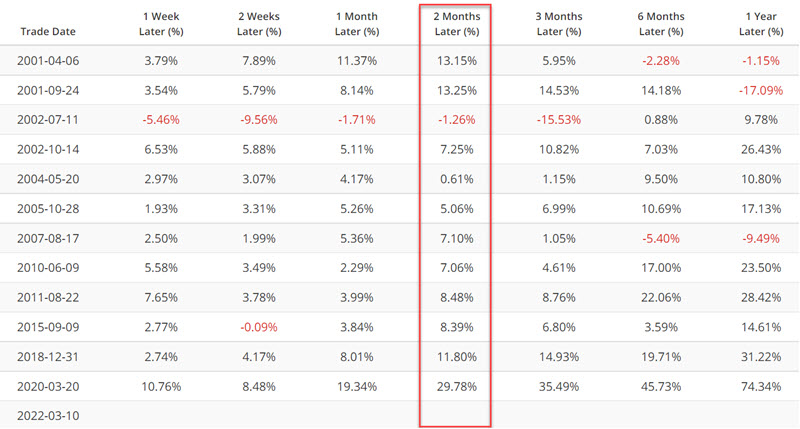
The results for all previous signals appear in the table below.

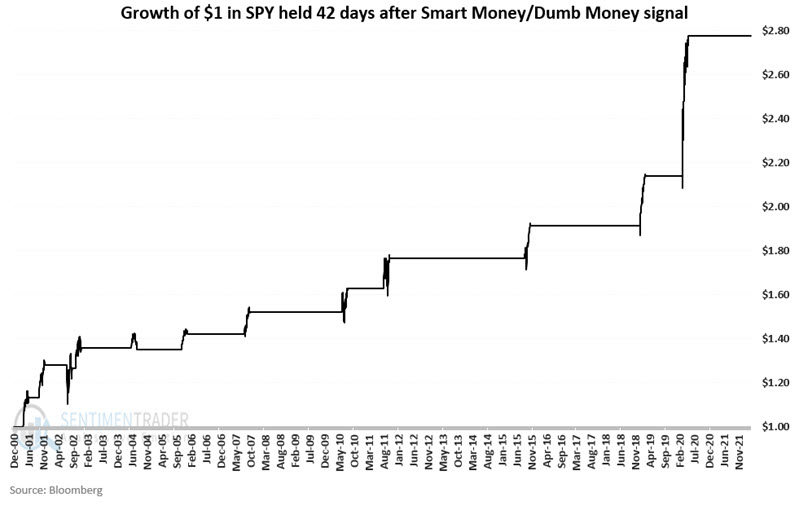
The chart below displays the growth of $1 invested in SPY for 42 trading days after each previous signal. The key things to note are the steady nature of the gains and the lack of significant drawdowns.

What the research tells us…

Do the very favorable results shown above guarantee that stocks are headed higher in the weeks and months ahead? Not at all. Just because price action following previous signals has witnessed relatively low drawdowns and consistent profitability does not mean that the latest signal won't be the exception to the rule. But history certainly suggests the potential for better days ahead.  

Sorry, you don't have access to this report

Upgrade your subscription plan to get access
Go to Dasboard
PRODUCTS
SentimenTrader
Trading Tools
Indicators & Data API
‍
Strategies & Scanner
‍
Research Reports
FREE
RESOUrCES
Simple Backtest
Calculator
Simple Seasonality
Calculator
The Kelly Criterion
Calculator
Sentiment Geo Map
‍
Public Research Reports
‍
Pricing
Bundle pricing
‍
Announcements
‍
FAQ
COMPANY
‍
About
‍
In the News
‍
Testimonials
‍
Client Success Stories
CONTACT
‍
General Inquiries
‍
Media Inquiries
‍
Financial Professionals Inquiries
‍
© 2025 Sundial Capital Research Inc. All rights reserved.
Setsail Marketing
TermsPrivacyAffiliate Program
Risk Disclosure: Futures and forex trading contains substantial risk and is not for every investor. An investor could potentially lose all or more than the initial investment. Risk capital is money that can be lost without jeopardizing ones’ financial security or life style. Only risk capital should be used for trading and only those with sufficient risk capital should consider trading. Past performance is not necessarily indicative of future results.

Hypothetical Performance Disclosure: Hypothetical performance results have many inherent limitations, some of which are described below. No representation is being made that any account will or is likely to achieve profits or losses similar to those shown; in fact, there are frequently sharp differences between hypothetical performance results and the actual results subsequently achieved by any particular trading program. One of the limitations of hypothetical performance results is that they are generally prepared with the benefit of hindsight. In addition, hypothetical trading does not involve financial risk, and no hypothetical trading record can completely account for the impact of financial risk of actual trading. for example, the ability to withstand losses or to adhere to a particular trading program in spite of trading losses are material points which can also adversely affect actual trading results. There are numerous other factors related to the markets in general or to the implementation of any specific trading program which cannot be fully accounted for in the preparation of hypothetical performance results and all which can adversely affect trading results.

Testimonial Disclosure: Testimonials appearing on this website may not be representative of other clients or customers and is not a guarantee of future performance or success.