Products
SentimenTrader Trading Tools
‍
Backtest Engine
My Trading Toolkit
Correlation Analysis
Seasonality
Market Prediction
Indicators & Data API
‍
Proprietary Indicators & Charts
Market Data API
Strategies & Scanner
‍
50+ Trading Strategies
Smart Stock Scanner
Smart Option Scanner
Research Reports
‍
Research Solutions
Reports Library
Free Resources
Simple Backtest Calculator
Simple Seasonality Calculator
The Kelly Criterion Calculator
Sentiment Geo Map
Public Research Reports
Education
Sentiment Indicators
Technical Indicators
Pricing
Company
About
In the News
Testimonials
Client Success Stories
Contact
Log inLoginSign up
< BACK TO ALL REPORTS

Smart money buyers have stepped away

Jason Goepfert
2020-09-18
Corporate insiders in S&P 500 companies have pulled back on their buying activity, causing the velocity of the Buy/Sell Ratio to plunge.

One of the supporting legs of the rally beginning in the spring and lasting through June had been buying pressure from corporate insiders and other "smart money" investors. That began to moderate in August, especially among technology shares.

Lately, buying interest has dropped off significantly among members of the S&P 500. While there are still a large number of buyers over the past 6 months thanks to heavy interest in the spring, it's dropping quickly.

The 4-week rate of change in the Corporate Insider Buy/Sell Ratio, which we call Velocity, has dropped below -20% for stocks in the S&P 500. According to the Backtest Engine, future returns have been poor whenever broad-market insider Velocity was below 20%.

Smart money corporate insider buy sell velocity

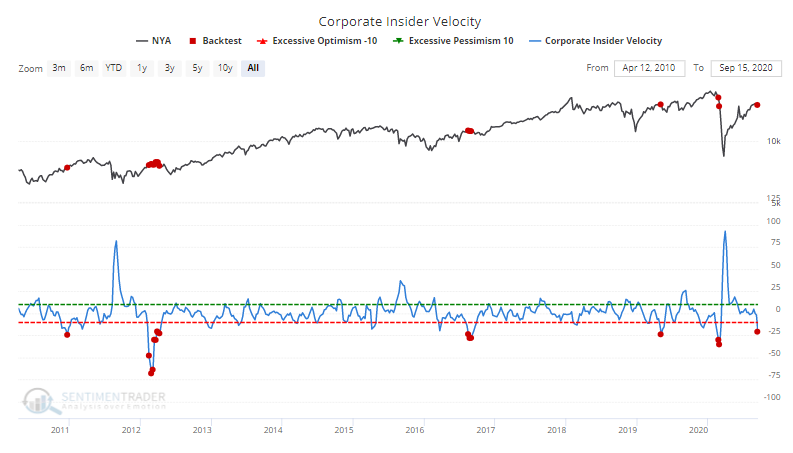
The deeply negative Velocity is a concern, but it's minor. The reason is that the overall level of the Buy/Sell Ratio is still very high and it tends to be a longer-term metric.


This is an abridged version of our recent reports and notes. For immediate access with no obligation, sign up for a 30-day free trial now.

We also looked at:

  • Returns after insider velocity falls below -20%
  • Another look at smart money - the First Hour / Last Hour indicator (aka Smart Money Index)
  • And another - commercial hedger activity in equity index futures
  • The equal-weighted S&P 500 has surged relative to the cap-weighted version, and it has been historically meaningful
  • Sentiment on Canadian and Australian stocks has soured
  • What happens after gold's Bollinger Bands narrow after a big rally
PRODUCTS
SentimenTrader
Trading Tools
Indicators & Data API
‍
Strategies & Scanner
‍
Research Reports
FREE
RESOUrCES
Simple Backtest
Calculator
Simple Seasonality
Calculator
The Kelly Criterion
Calculator
Sentiment Geo Map
‍
Public Research Reports
‍
Education
Sentiment Indicators
‍
Technical Indicators
‍
Pricing
Bundle pricing
‍
FAQ
‍
Announcements
‍
COMPANY
‍
About
‍
In the News
‍
Testimonials
‍
Client Success Stories
CONTACT
‍
General Inquiries
‍
Media Inquiries
‍
Financial Professionals Inquiries
‍
© 2026 Sundial Capital Research Inc. All rights reserved.
Setsail Marketing
TermsPrivacyAffiliate Program
Risk Disclosure: The information and tools provided are for research and analytical purposes only and are not intended as investment advice. Market analysis involves uncertainty, and outcomes may differ from expectations. Users should conduct their own due diligence and consider their individual circumstances before making any financial decisions. Past performance is not necessarily indicative of future results.

Hypothetical Performance Disclosure: Hypothetical performance results have many inherent limitations, some of which are described below. No representation is being made that any account will or is likely to achieve profits or losses similar to those shown; in fact, there are frequently sharp differences between hypothetical performance results and the actual results subsequently achieved by any particular trading program. One of the limitations of hypothetical performance results is that they are generally prepared with the benefit of hindsight. In addition, hypothetical trading does not involve financial risk, and no hypothetical trading record can completely account for the impact of financial risk of actual trading. for example, the ability to withstand losses or to adhere to a particular trading program in spite of trading losses are material points which can also adversely affect actual trading results. There are numerous other factors related to the markets in general or to the implementation of any specific trading program which cannot be fully accounted for in the preparation of hypothetical performance results and all which can adversely affect trading results.

Testimonial Disclosure: Testimonials appearing on this website may not be representative of other clients or customers and is not a guarantee of future performance or success.