Data &
Technology
Research
Reports
Report Solutions
Reports Library
Actionable
Strategies
Free
Resources
Simple Backtest Calculator
Simple Seasonality Calculator
The Kelly Criterion Calculator
Sentiment Geo Map
Public Research Reports
Free Webinar
Pricing
Company
About
Meet Our Team
In the News
Testimonials
Client Success Stories
Contact
Log inLoginSign up
< BACK TO ALL REPORTS

Small stocks have largest gains in 20 years

Jason Goepfert
2021-02-25
Small-cap stocks have outperformed large-cap stocks by more than 10% already this year. That's the widest spread in more than 20 years.

It's been a heck of a year already for small-cap stocks. The Russell 2000 has enjoyed a typical year's worth of gains, and it's only February.

As the Wall Street Journal notes, "smaller companies are more tied to the domestic economy than their large-cap counterparts, which make more money overseas."

The last time small stocks got off to such a roaring start relative to large stocks was in the year 2000, not exactly an auspicious precedent. Using the total return on small-cap stocks versus large-cap stocks going back to 1926, this is indeed the best relative performance for small stocks since 2000, even though it's far from their best-ever.

Small cap stocks outperform large caps by 10%

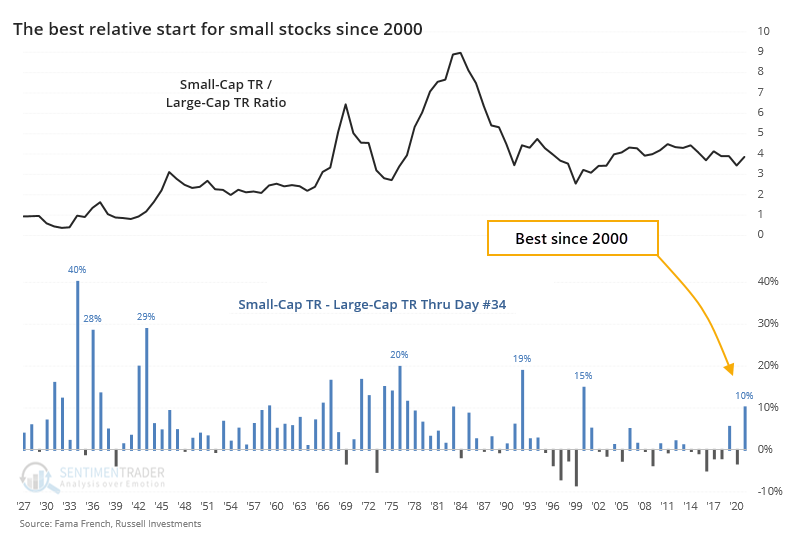
As for what it means, in the weeks and months ahead after similar occurrences, small stocks tended to keep their momentum. The medium-term proved to be a different matter.

What else we're looking at

  • Full returns in small-caps, large-caps, and the ratio between them after small stocks outperform by so much
  • The TLT fund hit a rarely seen oversold threshold
  • A trading strategy using simple rules to take advantage of copper's momentum
  • A look at the breadth of the rally in Asia-Pacific stocks

Stat Box

With a continued surge and easy comparisons from a year ago, more than 65% of energy stocks hit a 52-week high on Wednesday. That's the most 52-week highs for that sector in 16 years.


Sentiment from other perspectives

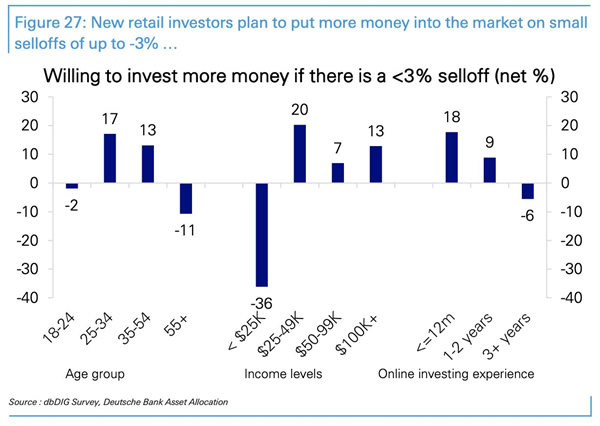
BTFD, man. According to a Deutsche Bank survey, the investors with the least experience are the ones most willing to step up and buy into a pullback, which nowadays only means losing 3% from peak value. Source: Sam Ro

willing to buy the dip

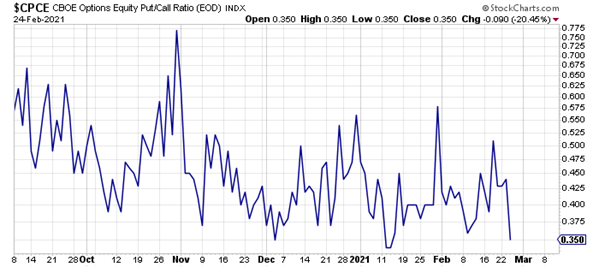
Options traders are doing that. The put/call ratio dropped to one of its lowest levels every on Wednesday as call option volume swamped put volume. Source: Helene Meisler

equity put call ratio

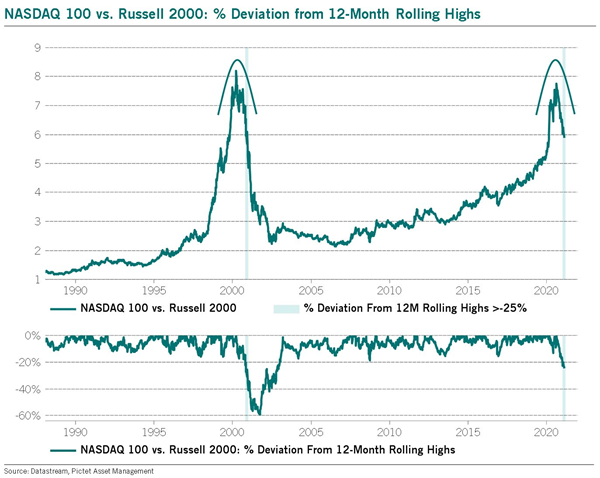
Will the tech train derail such confidence? For only the 2nd time in 30 years, the ratio of the Nasdaq 100 to Russell 2000, essentially the ratio of tech stocks to small stocks, has dropped more than 20% from its peak. The other one led to an ugly reckoning. Source: Julien Bittel

ratio of nasdaq 100 to russell 2000

DATA &
TECHnologies
IndicatorEdge
‍
BackTestEdge
‍
Other Tools
‍
DataEdge API
RESEARCH
reports
Research Solution
‍
Reports Library
‍
actionable
Strategies
Trading Strategies
‍
Smart Stock Scanner
‍
FREE
RESOUrCES
Simple Backtest
Calculator
Simple Seasonality
Calculator
The Kelly Criterion
Calculator
Sentiment Geo Map
‍
Public Research Reports
‍
Free Webinar
COMPANY
‍
About
‍
Meet our Team
‍
In the News
‍
Testimonials
‍
Client Success Stories
Pricing
Bundle pricing
‍
Announcements
‍
FAQ
© 2024 Sundial Capital Research Inc. All rights reserved.
Setsail Marketing
TermsPrivacyAffiliate Program
Risk Disclosure: Futures and forex trading contains substantial risk and is not for every investor. An investor could potentially lose all or more than the initial investment. Risk capital is money that can be lost without jeopardizing ones’ financial security or life style. Only risk capital should be used for trading and only those with sufficient risk capital should consider trading. Past performance is not necessarily indicative of future results.

Hypothetical Performance Disclosure: Hypothetical performance results have many inherent limitations, some of which are described below. No representation is being made that any account will or is likely to achieve profits or losses similar to those shown; in fact, there are frequently sharp differences between hypothetical performance results and the actual results subsequently achieved by any particular trading program. One of the limitations of hypothetical performance results is that they are generally prepared with the benefit of hindsight. In addition, hypothetical trading does not involve financial risk, and no hypothetical trading record can completely account for the impact of financial risk of actual trading. for example, the ability to withstand losses or to adhere to a particular trading program in spite of trading losses are material points which can also adversely affect actual trading results. There are numerous other factors related to the markets in general or to the implementation of any specific trading program which cannot be fully accounted for in the preparation of hypothetical performance results and all which can adversely affect trading results.

Testimonial Disclosure: Testimonials appearing on this website may not be representative of other clients or customers and is not a guarantee of future performance or success.