
Small options traders show this isn't a 2021 repeat

Key points:
- Small options traders are buying lots of calls...but also lots of puts
- Their net speculative activity is high but below some other peaks, and well below 2021's mania
- Future returns after similar positioning have been mediocre but still mostly positive
Retail reality
Soaring stock prices of money-losing companies. Massive first-day jumps of IPO shares. Heavy flows into leveraged ETFs. Record margin debt. The signs of speculative excess are percolating.
The best source we've found helpful over the years is monitoring the activity of the smallest options traders. This gives us a view of actual money commitments by (supposedly) the most wrong-headed and emotional traders, using a leveraged and expiring instrument to express their views.
This was a problem in 2021, and an opportunity in 2023. Based on some of the other activity we're seeing in the market, it would make sense that small options traders are jumping on board again, too. But...not quite.
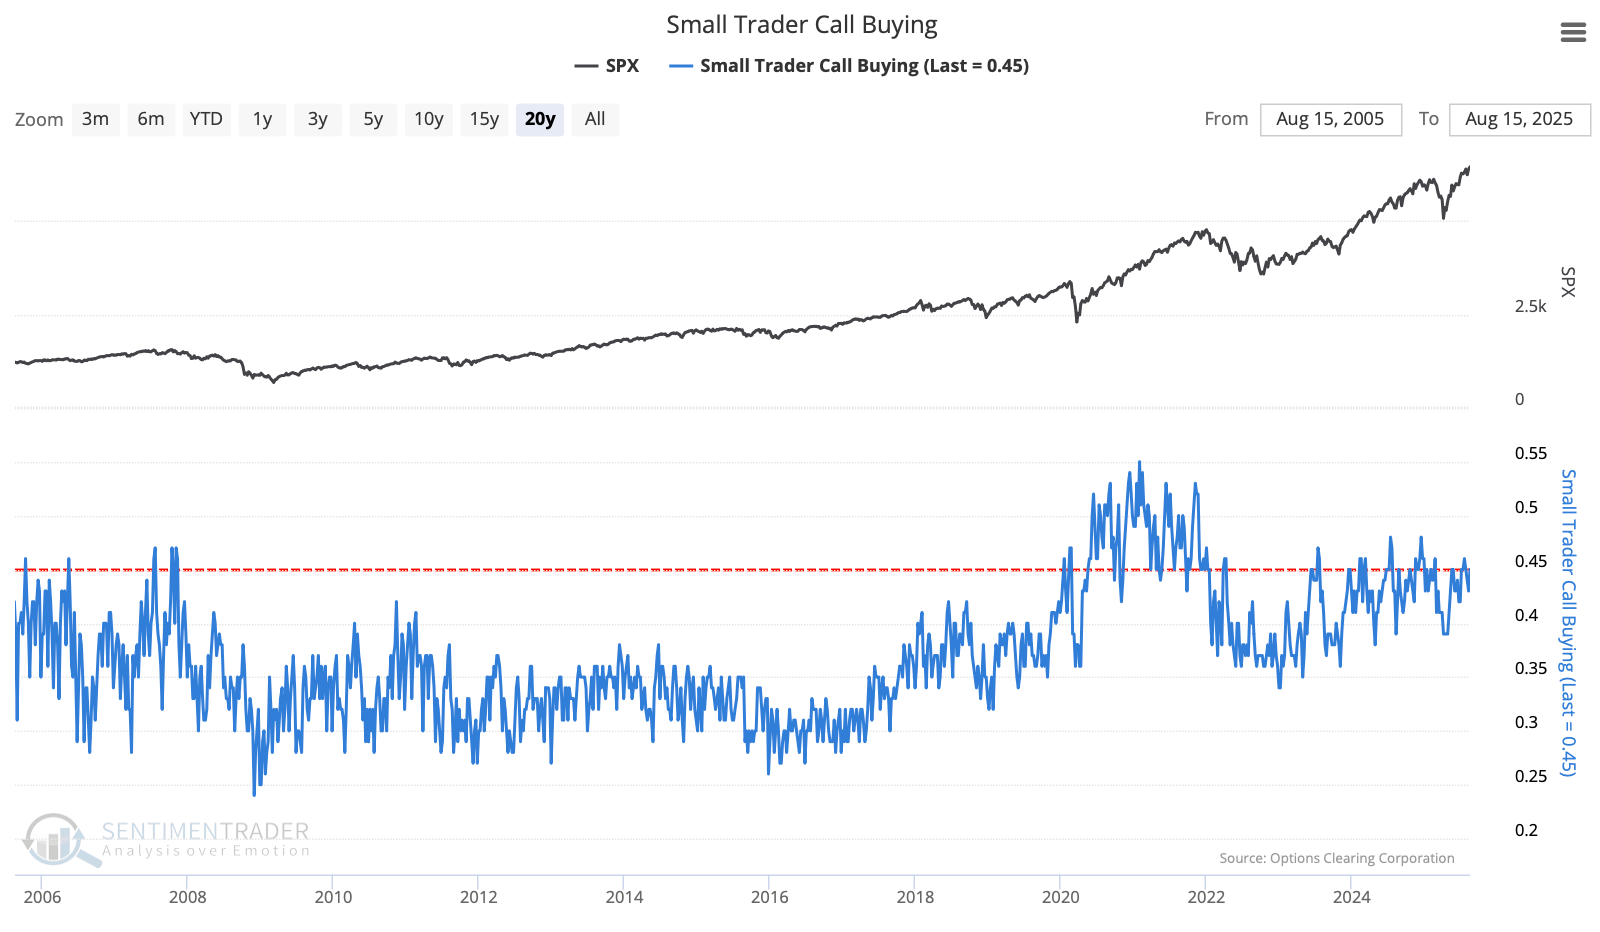
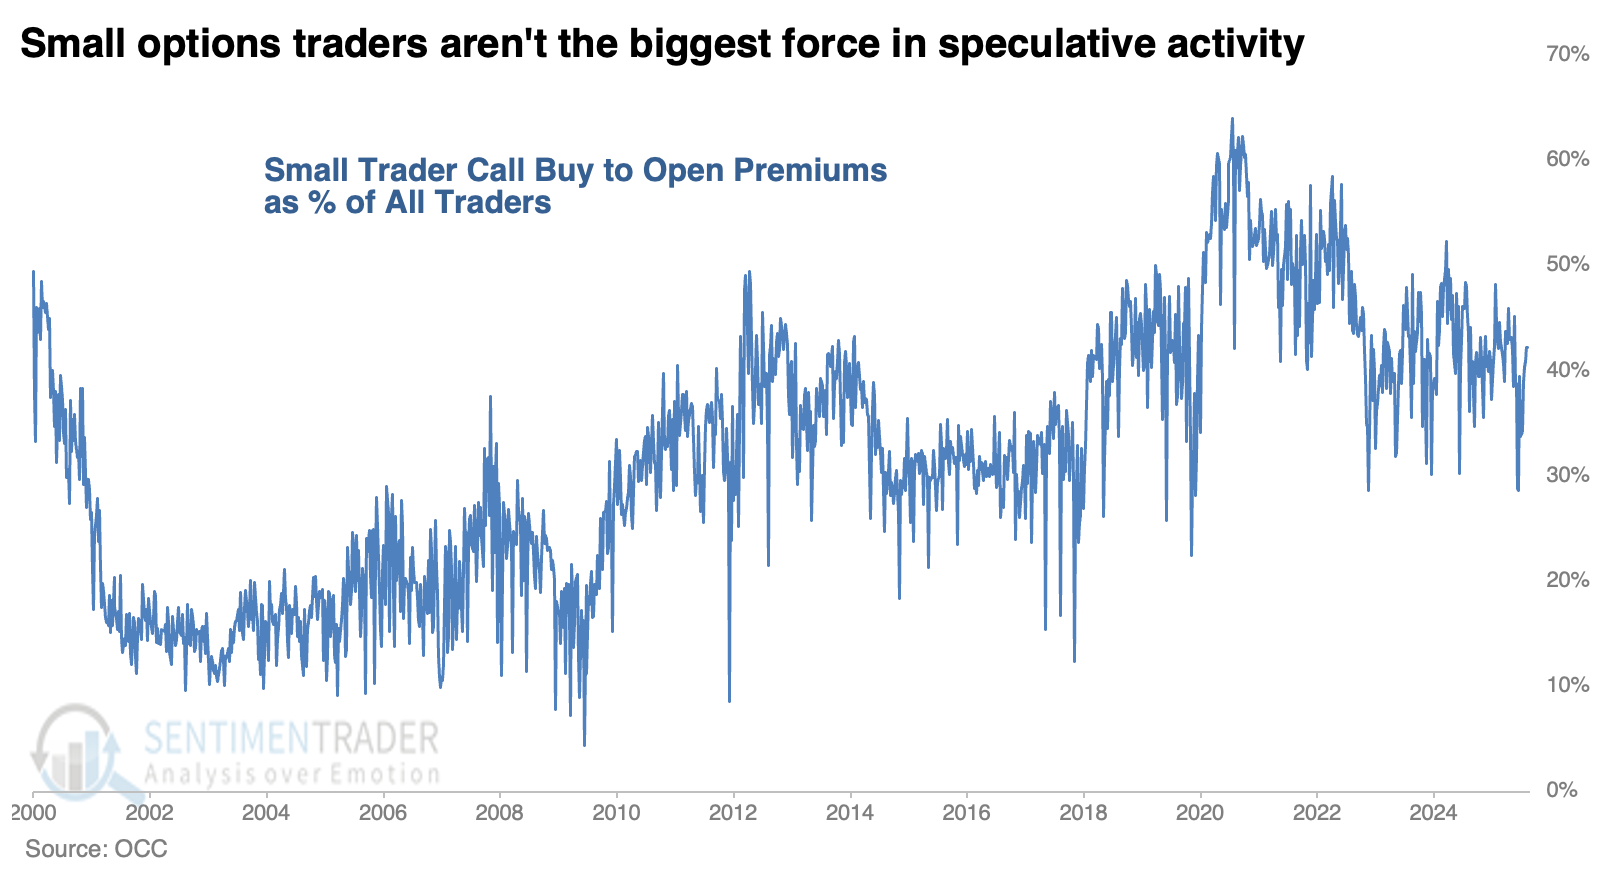
We usually start by looking at one of the purest measures, which is how much of their volume the smallest options traders concentrate on buying call options as an opening transaction. These are direct bets on a rising market, and there is no question that it's high. Over the past 20 years, there have been few weeks when it has been higher, though in 2021 it was significantly so, and for a long time.
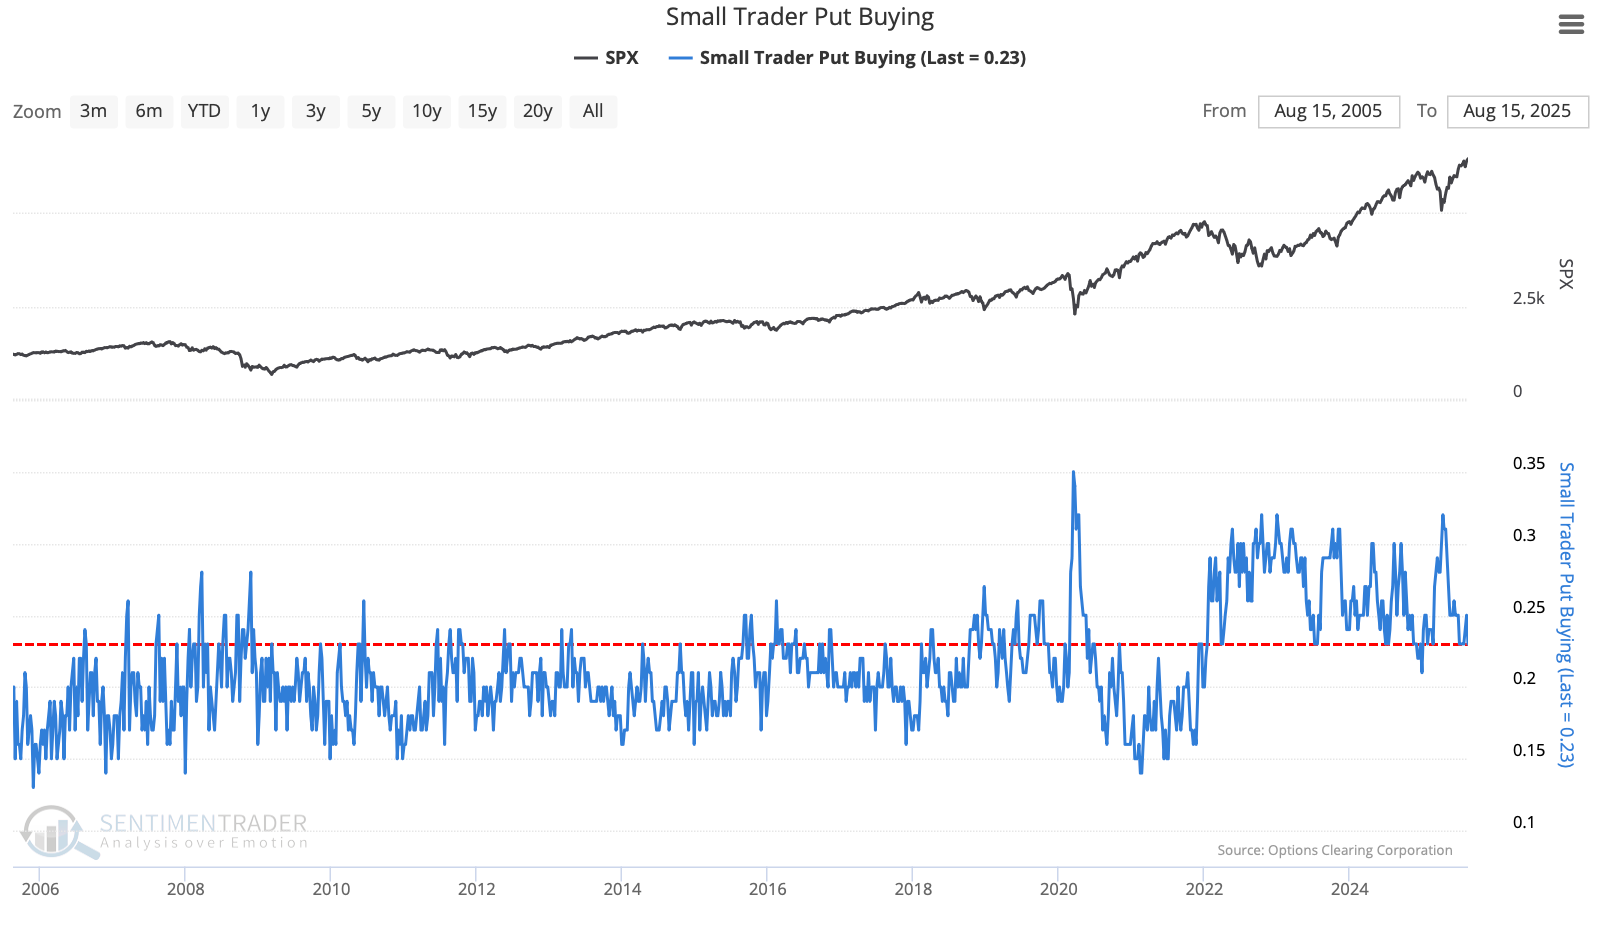
We've always railed against only looking at one side of the ledger. It's like saying someone with a high cash balance is flush, without noticing that they carry twice as much debt and are on the verge of bankruptcy. So, the other side of call option buying is put option buying by this same cohort of traders. These are direct bets on a declining market. Lo and behold, this activity is also high, meaning that many of these traders are also, or alternatively, betting on a market drop.
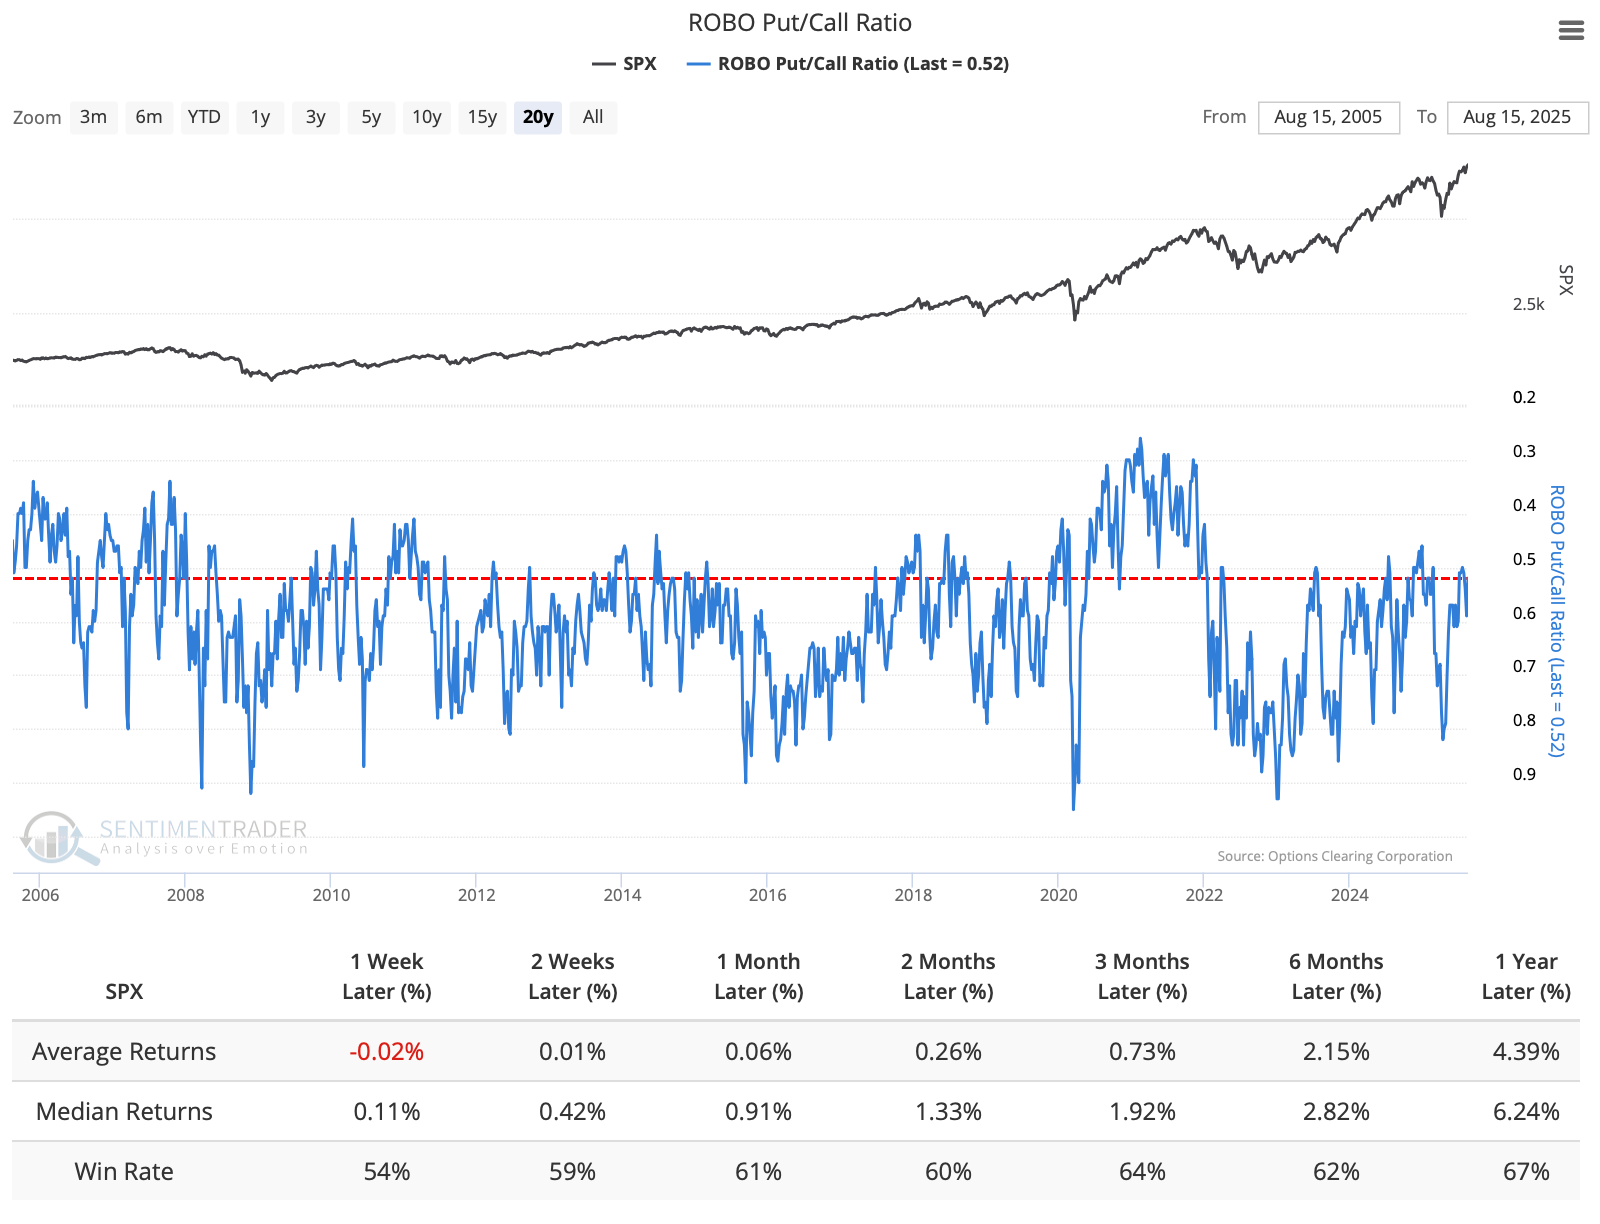
The ROBO Put/Call Ratio nets this activity to give us a clearer picture of how these traders position themselves. At the current level, S&P 500 returns were okay going forward. They weren't great, but not terrible, either, with a generally positive bias.
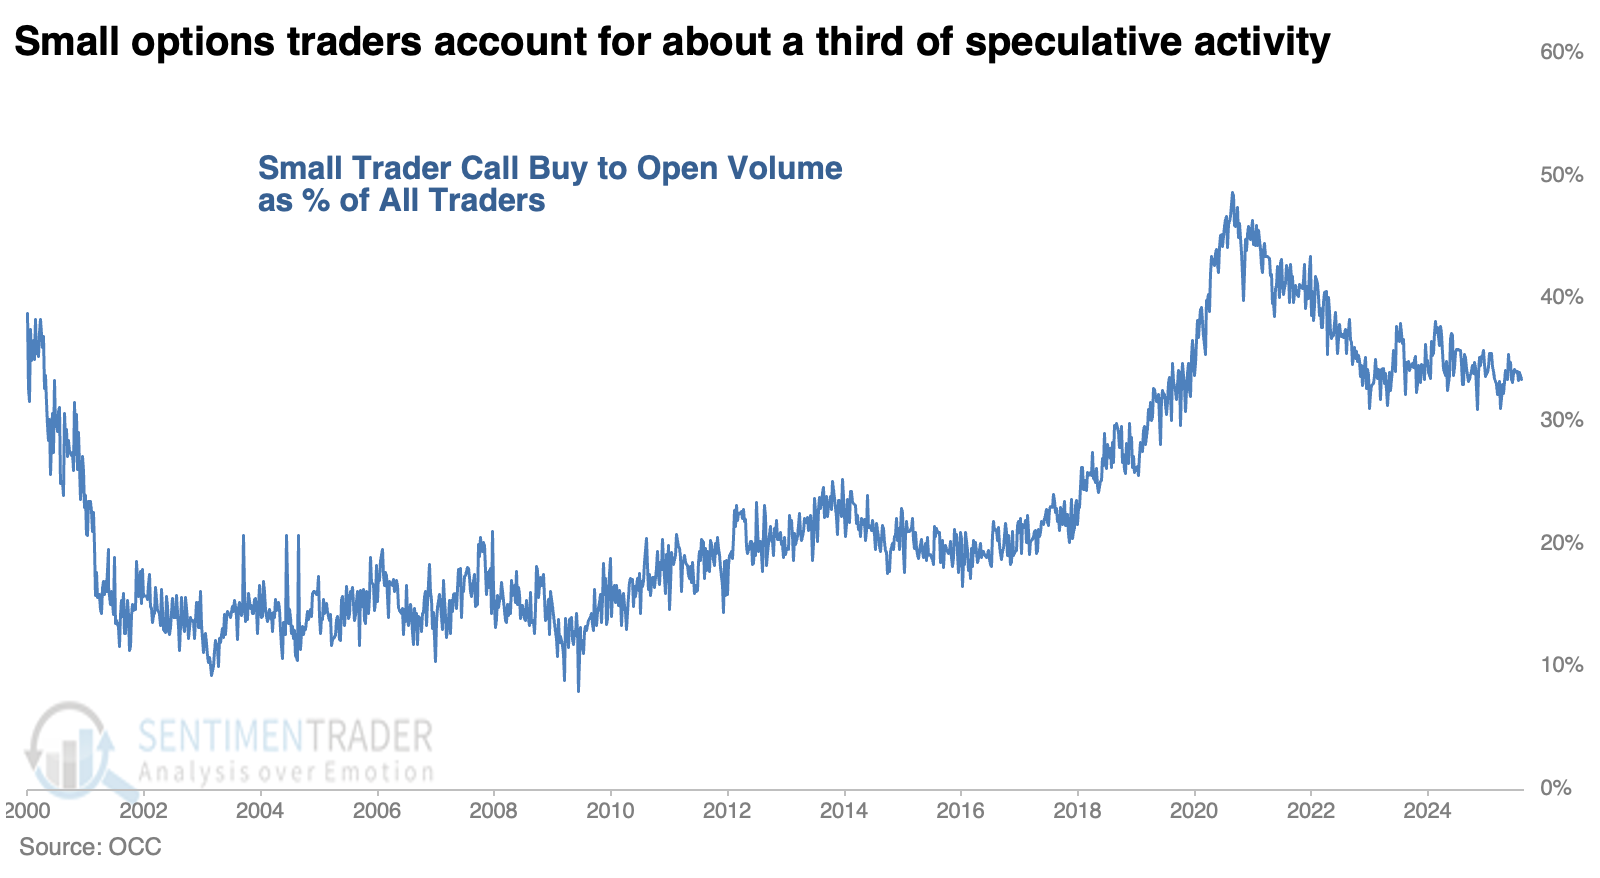
Less of a force
As a share of total options volume, small traders are still a force, but not to the same level they were at in 2021. At that peak in FOMO, they accounted for about half of all call buying volume; now they account for about a third. That's still about twice as much as during the previous decade.
On a dollar basis, the premiums that the smallest traders are spending on call options account for a little over 40% of the total. It was more than 60% at the 2021 peak.
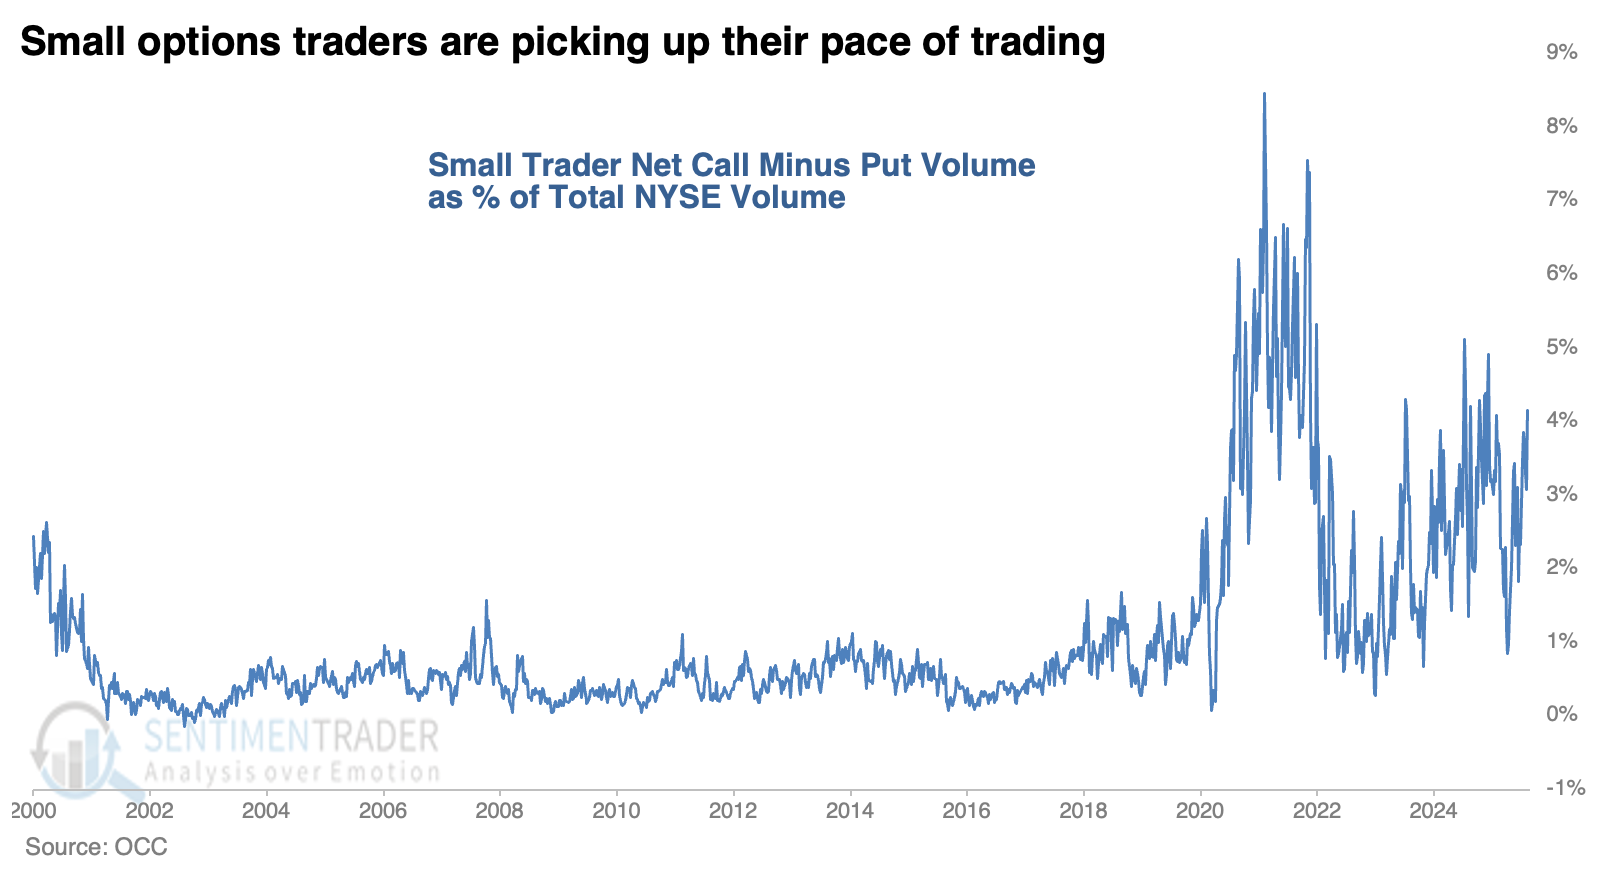
If we look at the net speculative activity (call buys to open minus put buys to open) for the smallest traders and express it as a percentage of total NYSE volume, we can see that it's very high. It was more than double the current amount at the 2021 peak.
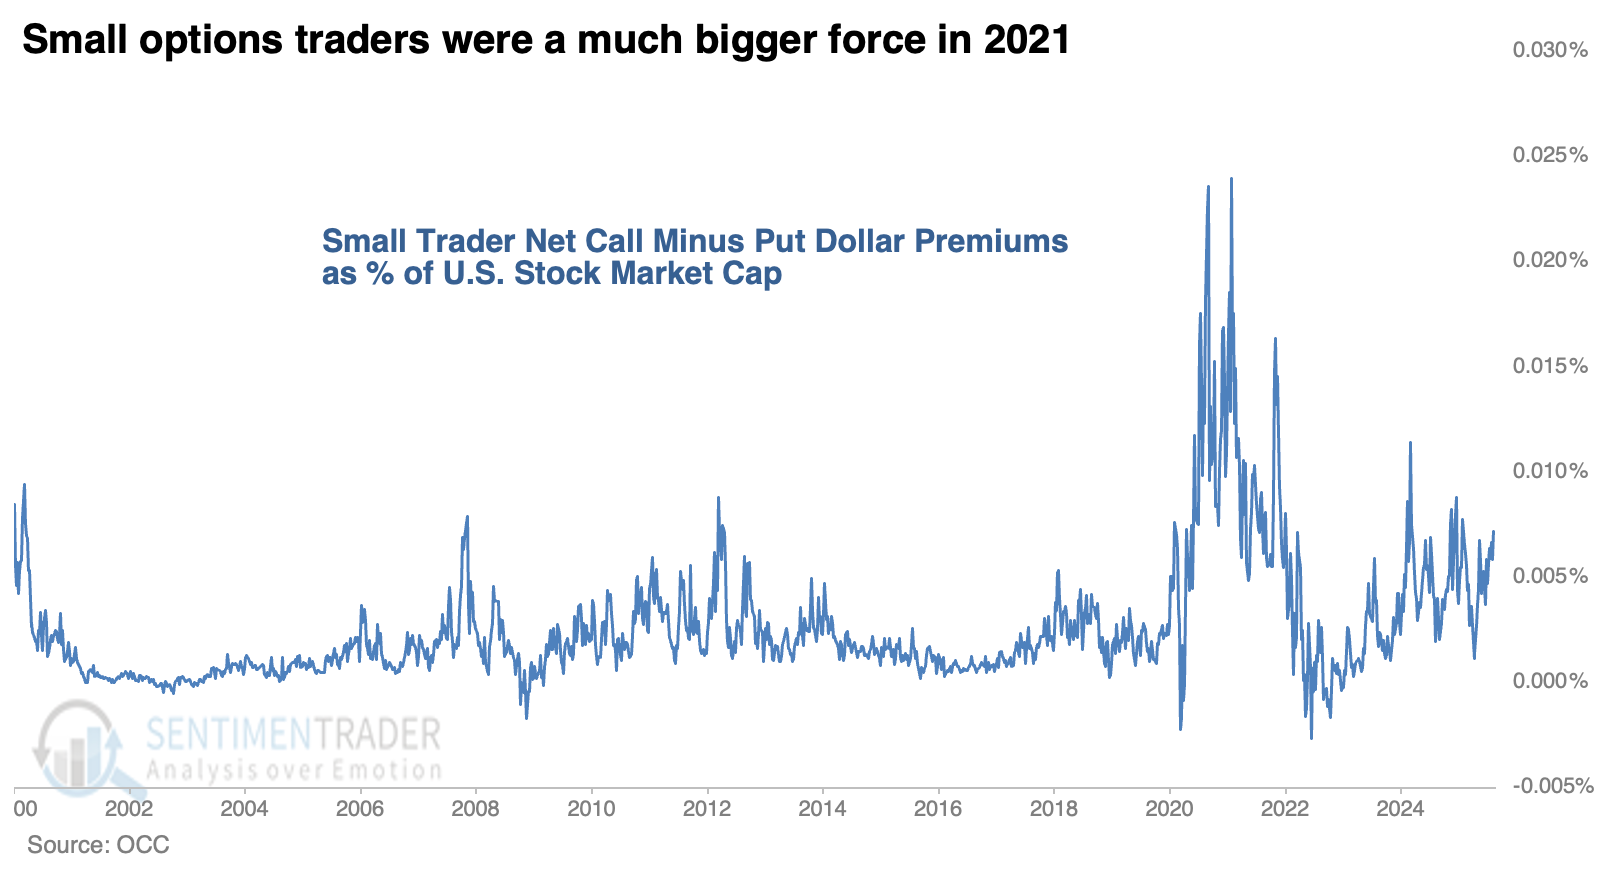
When we look at the dollar values committed to these speculative periods, it's less of a worry. The premiums spent on call options minus put options, as a percentage of the total market capitalization of the U.S. stock market, are historically high. But they have been exceeded not only by 2021 (by far) but also by other weeks in 2024, 2007, and 2012.
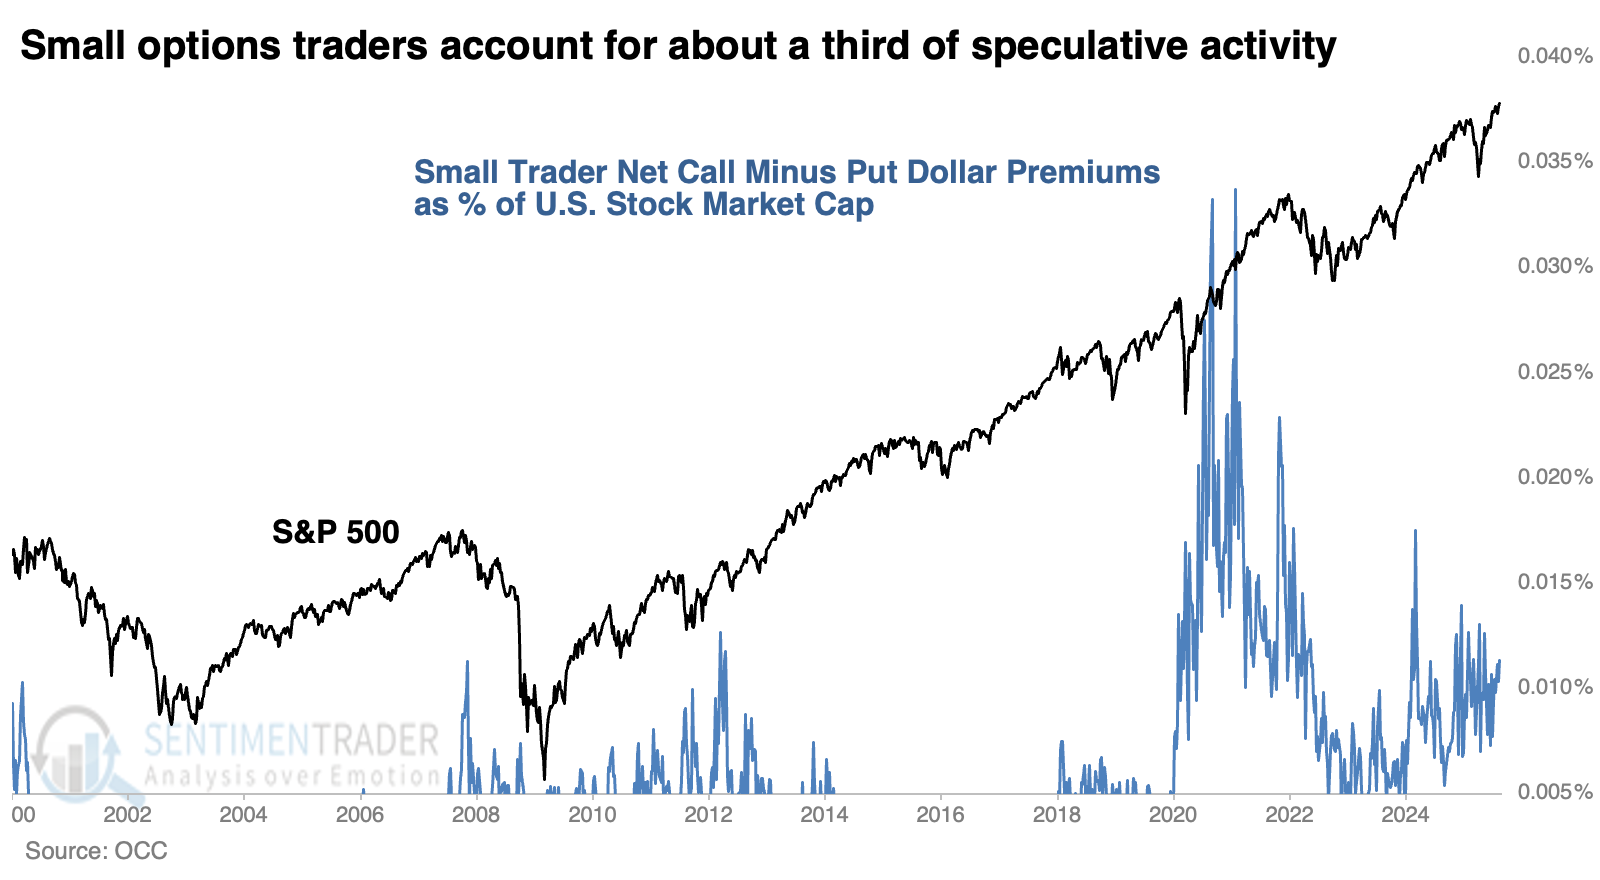
When we superimpose the S&P 500 against the most extreme speculative periods, we see that it preceded serious trouble in 2001-02 and 2008. It did eventually in 2022, but not before a massive rally. Some of the other instances saw mostly modest pullbacks, if any.
What the research tells us...
We are always on high alert about sentiment extremes. It's usually easy to make a case that investors are acting in an extreme manner based on one or two indicators, which is why we prefer to rely more heavily on aggregate models across various measures.
If we had to pick one indicator most likely to reliably signal a sentiment extreme, it would be opening purchases of options by small options traders. We've used this as a go-to indicator for decades, and it continues to prove effective. Currently, it suggests a moderate level of speculative activity, but certainly not at 2021 levels, and not even equalling what we saw at various points in 2024. It's hard to make the case that retail traders are foaming-at-the-mouth bullish when buying as many put options as they are now, and net activity remains well below some prior peaks.