
Small options traders come back as buyers press

One of our primary points of focus since August has been the behavior of options traders. They broke all records dating back 20 years in terms of sheer speculative fervor.
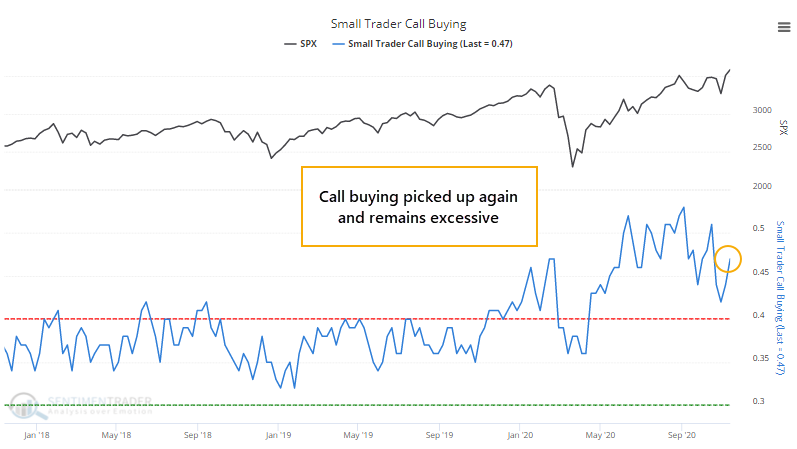
They let up a bit during the September swoon and recent market recoveries have emboldened them again, but not quite to the same degree. They got slapped with some losses and that seems to be tempering their willingness to try again.
Even so, the smallest of options traders spent 47% of their volume on buying call options to open last week. That is once again among the highest levels since 2000, though it's still below the peaks from recent months.
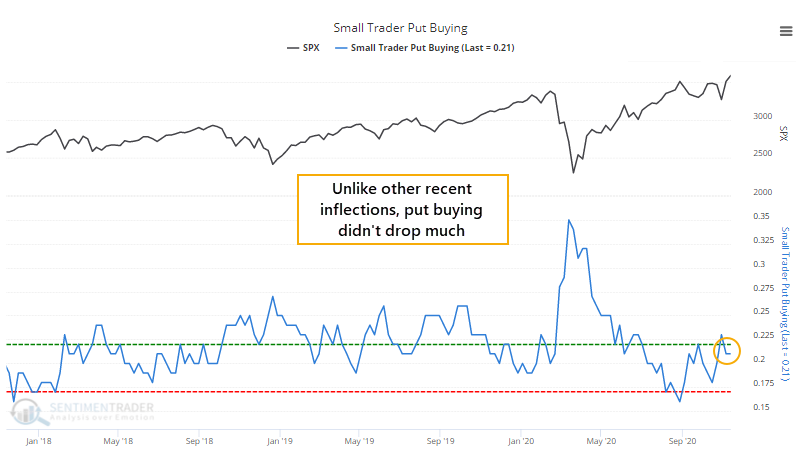
One modest difference is that they didn't completely abandon the protective allure of put options. They still spent more than 20% of their volume there, quite a bit above recent extremes.
As a result, the ROBO Put/Call Ratio, which stands for Retail-Only-Buy-to-Open, dropped below its extreme threshold again. It's still above the extremes from recent months, but we can see from the chart that the S&P 500's annualized return when the Ratio is below its lower threshold is a miserly -4.2%.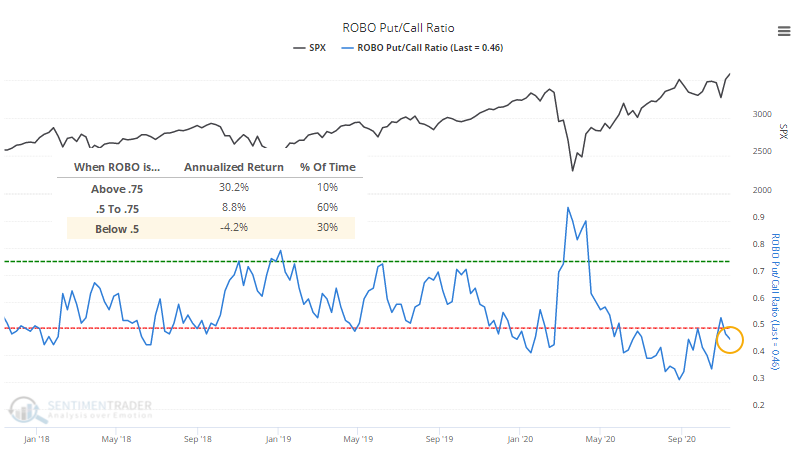
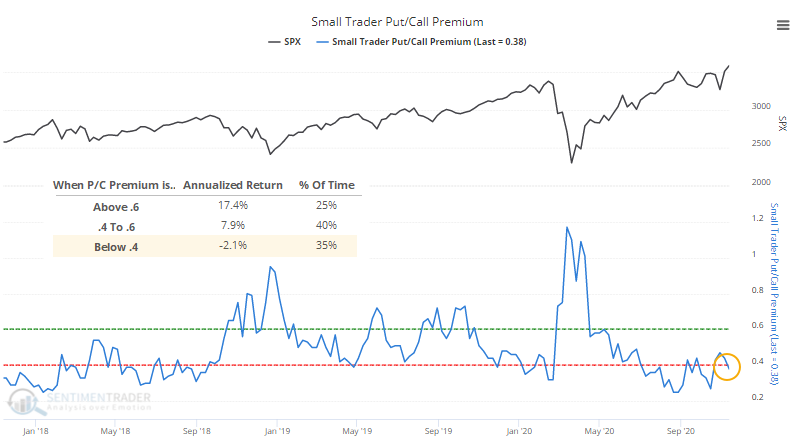
Likewise, they spent quite a bit more money on those speculative call options than they did on protective puts, so the Small Trader Put/Call Premium also dropped below its lower threshold. Again, that preceded poor annualized returns for the S&P.
Across all trader sizes and all option configurations, volume in bullish strategies last week was 40% higher than volume in bearish strategies, so the Options Speculation Index hit 1.40.
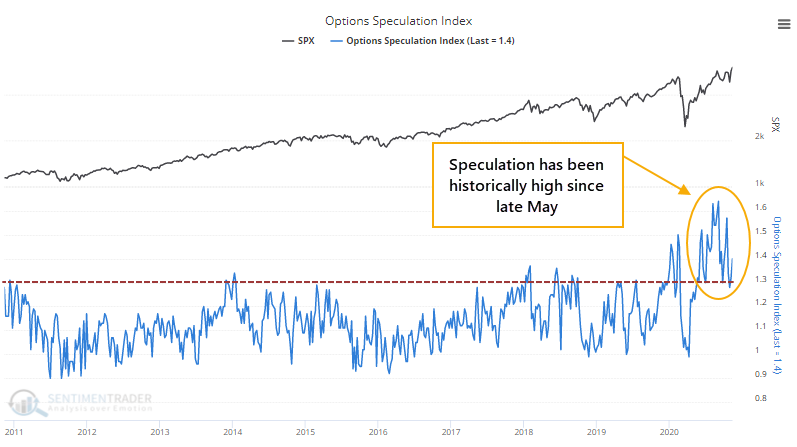
Since the bubble burst in 2000, no week had seen this figure higher than 1.4 prior to 2020. Since then, it has triggered during 18 weeks, which the Backtest Engine shows led to generally poor returns.
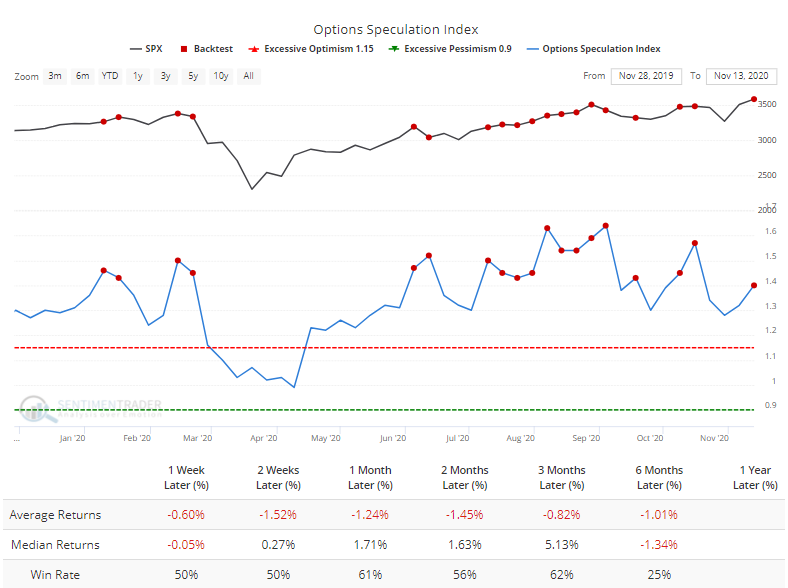
Those returns would have been significantly worse if we just excluded July. The momentum that carried stocks higher then accounted for virtually all of the positive shorter-term returns.
The renewed push in call option buying is a concern, and there is no question that traders remain historically aggressive. Using only very recent history, perhaps it's a modestly good sign that at least they're still buying a few puts and haven't gone into full-bore frenzy mode like August. The biggest caveat here is that even though stocks can and do rally after such confidence among options traders, shorter-term forward returns have a strong tendency to be muted (and temporary) if they are positive at all.
One potential concern is that these options traders have been pricing in more volatility in volatility itself. As Bloomberg notes, the VVIX is now 5 times greater than the VIX.

Not quite sure how they're looking at this, but we can't confirm the VIX's performance over the next 2 months. It did tend to rise over the next 1-3 months, but it wasn't consistent. There were some very large gains in there from 2007-2011 - they were just hard to rely on as a warning sign.
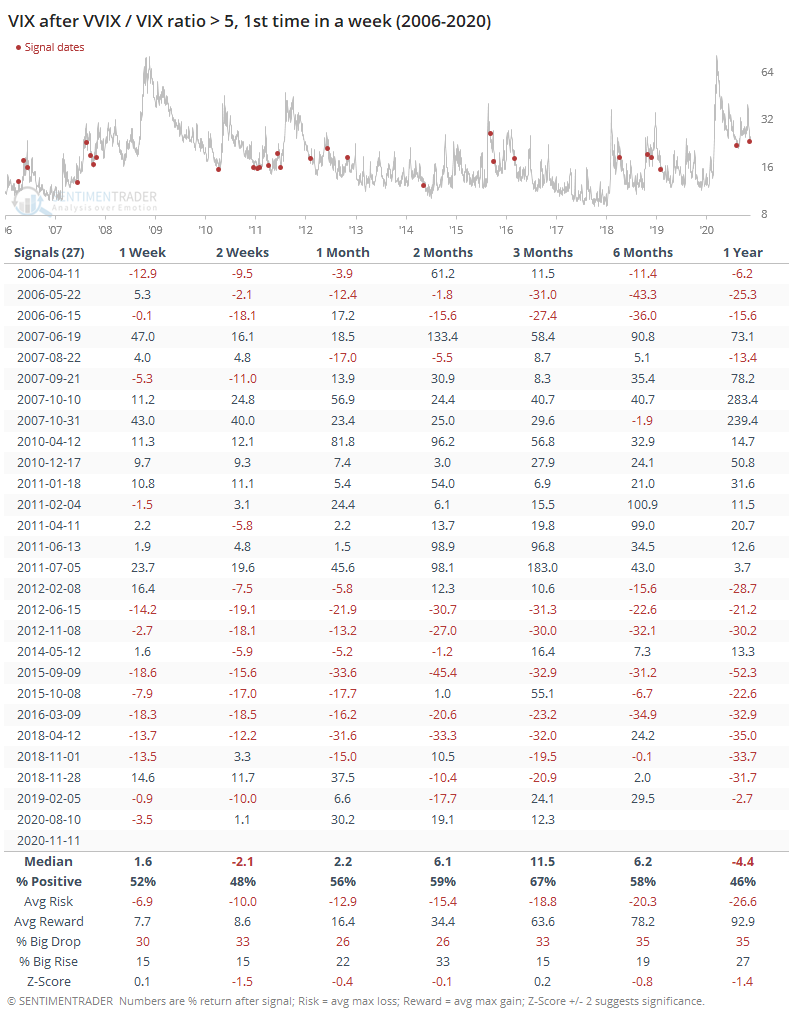
Regardless, the S&P 500 held up just fine.
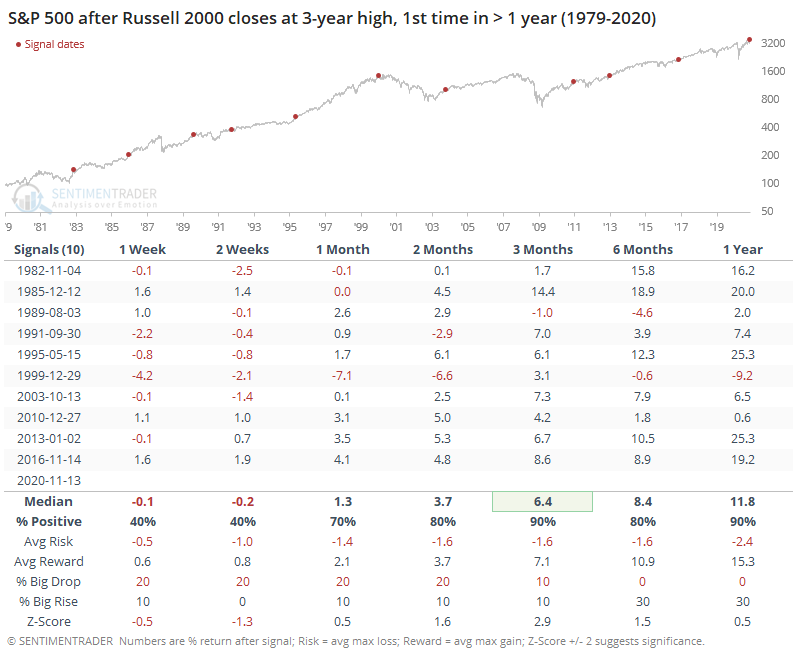
Despite the potential warnings, momentum remains extremely strong as we've outlined multiple times over the couple of weeks. Friday's rally was the icing on the cake, especially for smaller stocks, with the Russell 2000 reaching a multi-year high for the first time in over a year. When it's done that before, it never lost ground over the next month.
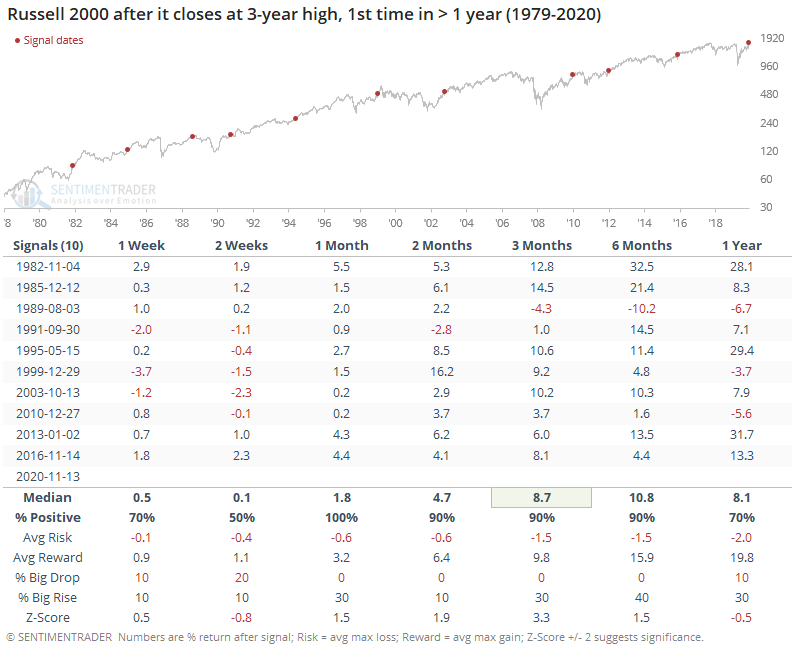
That has had very positive implications for the S&P 500 as well, with an exceptional risk/reward ratio out 2 months and beyond.
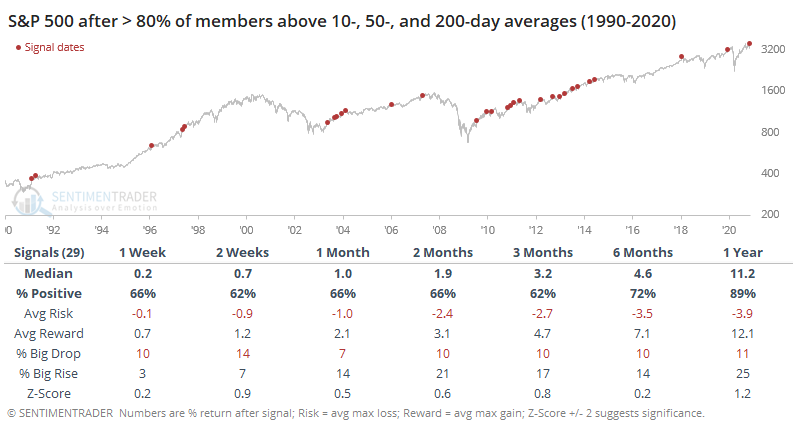
Thanks in part to the renewed vigor of small-cap stocks, breadth figures have been outstanding. Within the S&P 500, more than 85% of the stocks are trading above their 10-, 50-, and 200-day moving averages, a rare confluence of uptrends on all time frames.
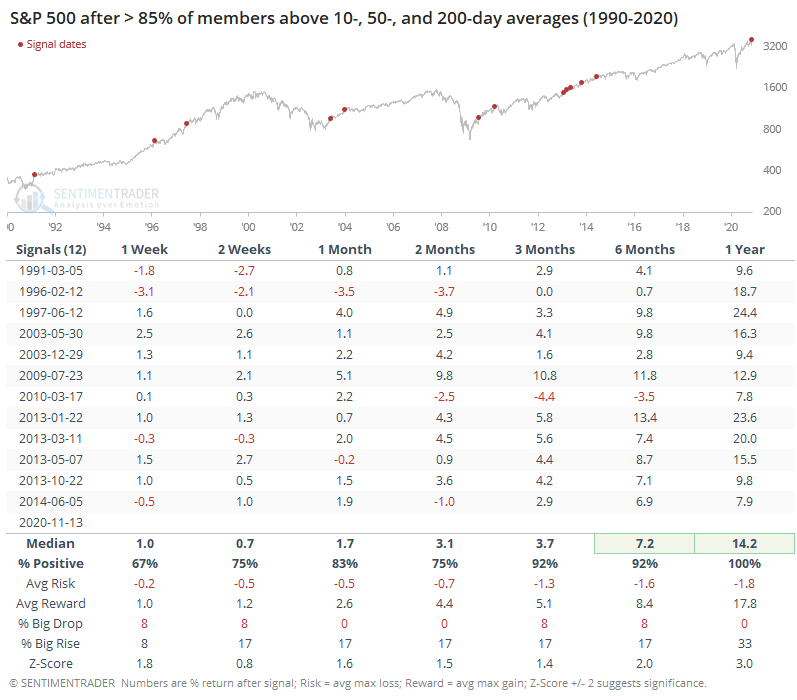
Confirming other measures from recent weeks, this kind of widespread buying interest has resulted in exceptionally positive returns over a medium- to long-term time frame.
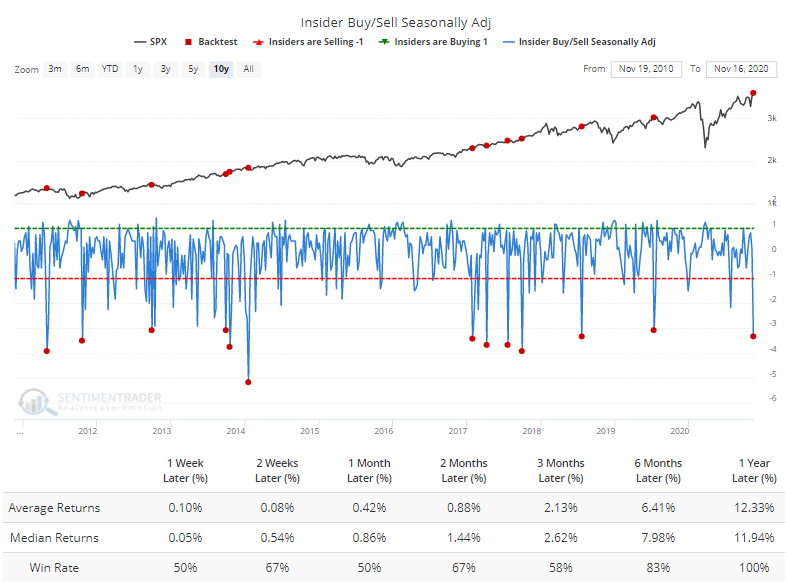
There are some initial signs that corporate insiders picked up their selling pace, but overall volume is likely still skewed by earnings season. Also, selling has typically been much less reliable than buying, with the Backtest Engine showing mostly positive returns in the S&P 500 following negative spikes in the seasonally-adjusted insider buy/sell ratio.
We're once again in a situation with a very favorable market environment, historically impressive participation, and high optimism. The Smart Money / Dumb Money Confidence Spread is back below -50%, and we've gone over that in recent years, that's been a decent setup to weakness once prices started to wobble. Even the S&P falling below its 20-day average would be a decent sign that optimism is on the cusp of being unwound. The medium- to long-term implications of yet another round of breakouts and breadth thrusts, however, suggest that even a pullback from overly optimistic conditions should only be temporary.