Data &
Technology
Research
Reports
Report Solutions
Reports Library
Actionable
Strategies
Free
Resources
Simple Backtest Calculator
Simple Seasonality Calculator
The Kelly Criterion Calculator
Sentiment Geo Map
Public Research Reports
Free Webinar
Pricing
Company
About
Meet Our Team
In the News
Testimonials
Client Success Stories
Contact
Log inLoginSign up
< BACK TO ALL REPORTS

Small Caps have suffered a fast correction, the first in a year

Jason Goepfert
2021-12-01
Only 3 weeks after setting a new high, the small-cap Russell 2000 fell into a correction, more than 10% below its peak. This is its 4th-fastest correction ever. It also ended one of its longest streaks without a correction. Both behaviors tended to lead to more selling.

Key points:

  • The Russell 2000 just suffered one of its quickest corrections ever following a new high
  • It also ended one of its longest streaks without a correction
  • Both behaviors typically led to more selling pressure over the short- to medium-term

One of the quickest-ever corrections

Earlier this month, the small-cap Russell 2000 broke out of a long consolidation. When it's done that before, it had a strong tendency to keep going. While short-term returns were modestly positive, the index showed a positive return 2 months later 16 out of 18 times.

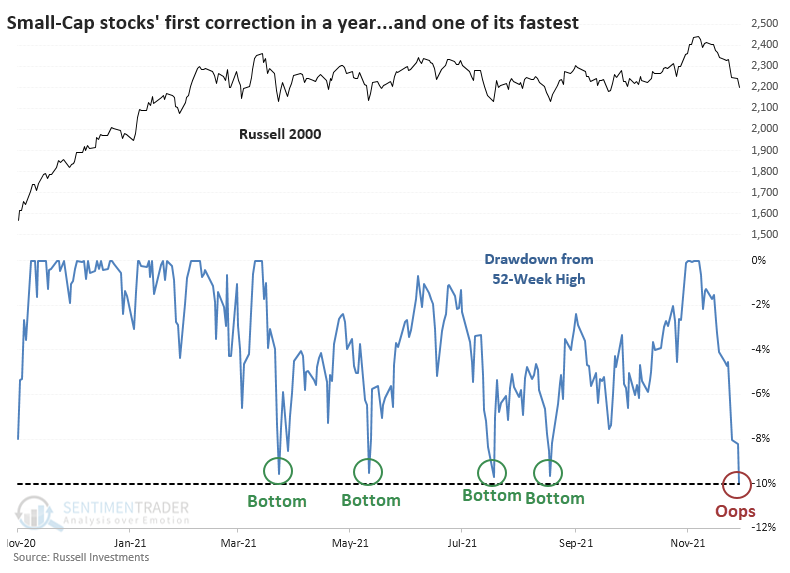
After its latest attempt, it promptly failed. And failed hard.

Within only a few weeks of trading at an all-time high, the Russell is already back into correction territory. This is its first drawdown of more than 10% (rounded) in more than a year.

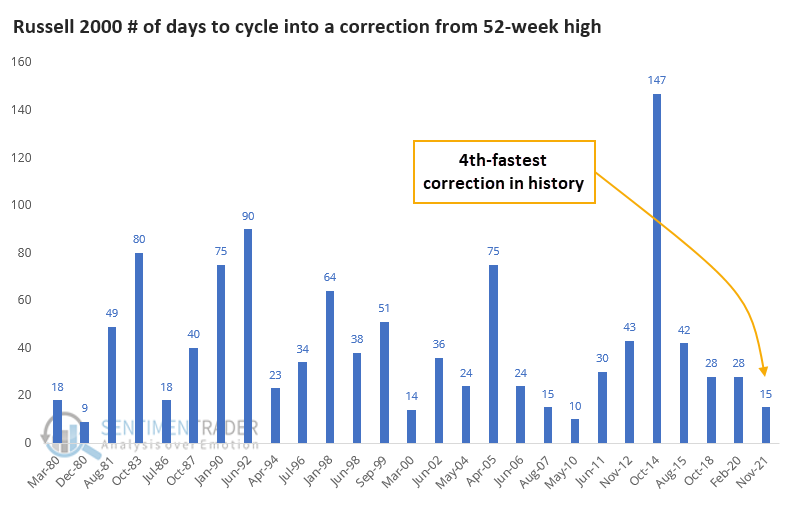
At only 15 days removed from a 52-week high, this is the Russell 2000's 4th-fastest correction.

Since the Russell's breakout failed (so far) to follow through on its historical tendencies, maybe we can't rely on its failure either. But for the most part, fast corrections equaled negative future returns for the small-cap index. Quick failures were not a good sign for these stocks, with 9 out of the 12 signals leading to a negative return either 2 or 3 months later. A few of them bounced in the short-term then crapped out.

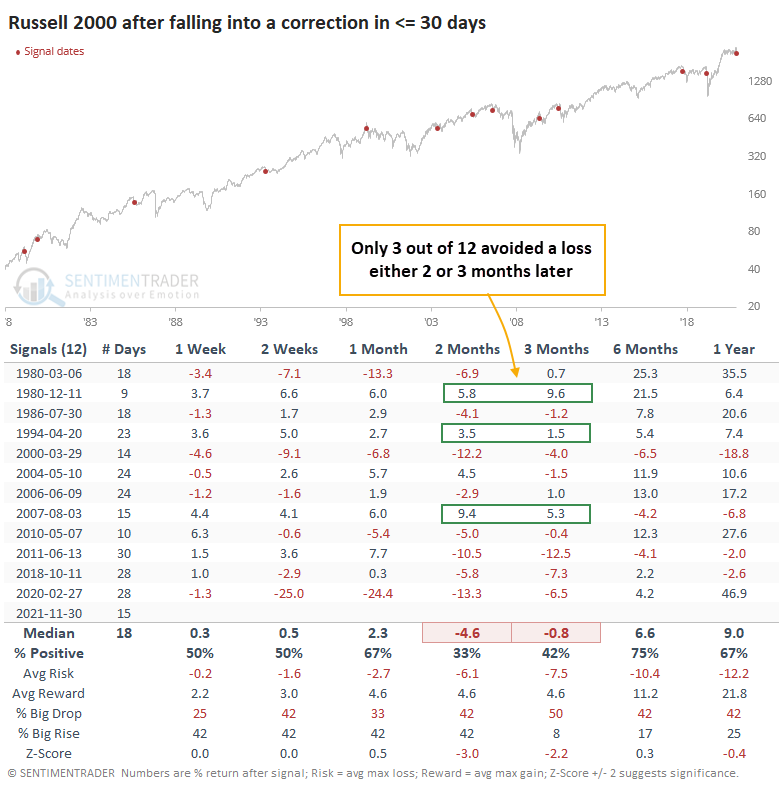
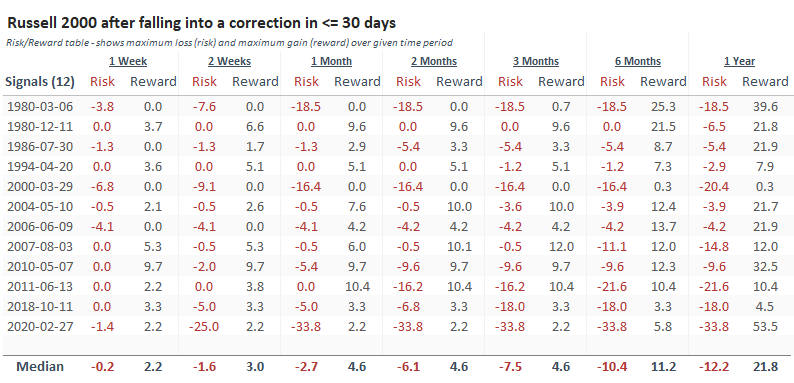
The Risk/Reward Tables shows just how poor the Russell tended to perform. Out of the 12 signals, 8 of them showed (almost) more risk than reward during the next 3 months.

The first correction in more than a year

This quick correction is also the Russell's first substantial pullback in a long time. It ends a streak of nearly 300 trading days since it last traded more than 10% below a 52-week high.

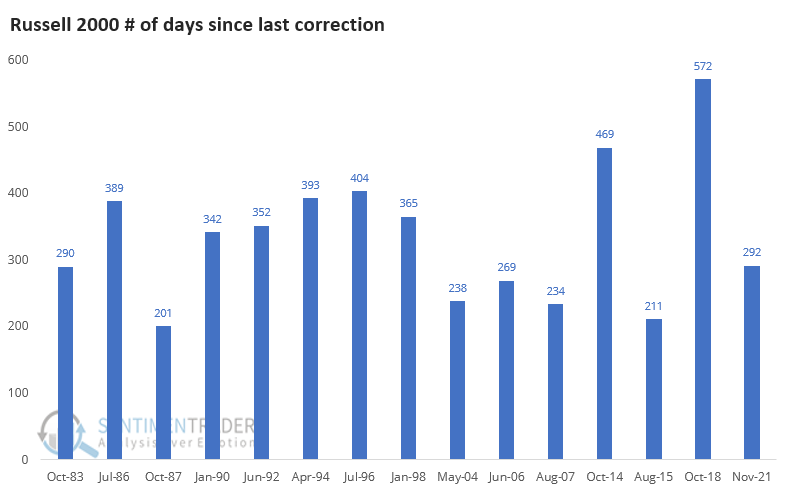
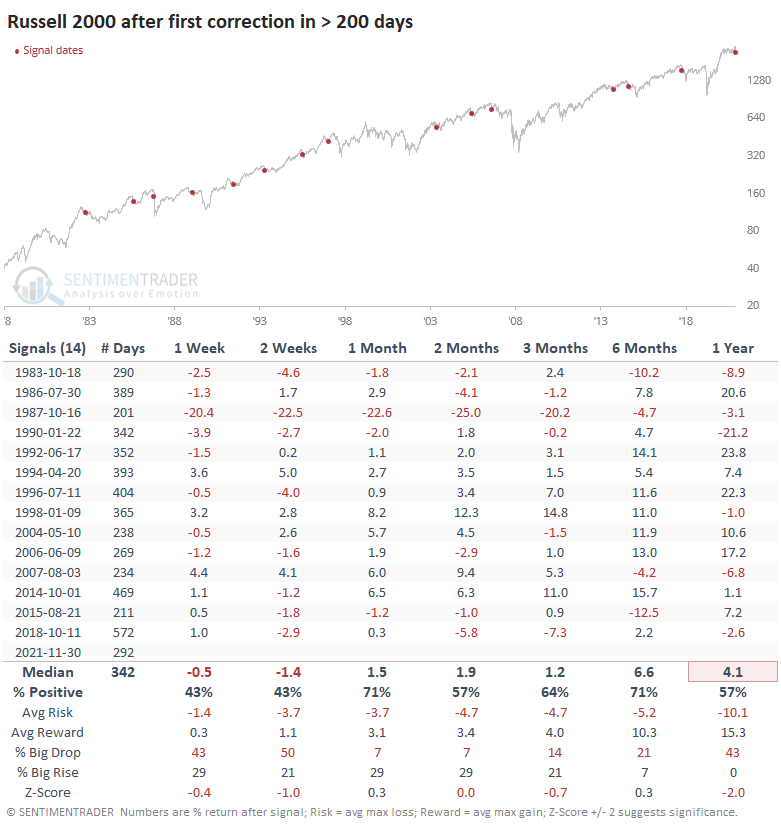
The first correction in more than 200 days tended to precede weak short-term returns and below-average medium-term ones. Out of the 14 other signals, only 2 managed to see large and sustained gains in the months ahead (June 1992 and July 1996). Most of the others either saw weak medium-term returns, or strong ones that ended up being given back over the next 6-12 months.

What the research tells us...

When a market breaks out and everyone gets excited, it tends to keep going. Quick and forceful failures after a breakout are relatively unusual, but the small-cap Russell 2000 just suffered one. The history of the index shows that investors tend to sell after fast failures, with consistently weak returns over the next 2-3 months. 

Sorry, you don't have access to this report

Upgrade your subscription plan to get access
Go to Dasboard
DATA &
TECHnologies
IndicatorEdge
‍
BackTestEdge
‍
Other Tools
‍
DataEdge API
RESEARCH
reports
Research Solution
‍
Reports Library
‍
actionable
Strategies
Trading Strategies
‍
Smart Stock Scanner
‍
FREE
RESOUrCES
Simple Backtest
Calculator
Simple Seasonality
Calculator
The Kelly Criterion
Calculator
Sentiment Geo Map
‍
Public Research Reports
‍
Free Webinar
COMPANY
‍
About
‍
Meet our Team
‍
In the News
‍
Testimonials
‍
Client Success Stories
Pricing
Bundle pricing
‍
Announcements
‍
FAQ
© 2024 Sundial Capital Research Inc. All rights reserved.
Setsail Marketing
TermsPrivacyAffiliate Program
Risk Disclosure: Futures and forex trading contains substantial risk and is not for every investor. An investor could potentially lose all or more than the initial investment. Risk capital is money that can be lost without jeopardizing ones’ financial security or life style. Only risk capital should be used for trading and only those with sufficient risk capital should consider trading. Past performance is not necessarily indicative of future results.

Hypothetical Performance Disclosure: Hypothetical performance results have many inherent limitations, some of which are described below. No representation is being made that any account will or is likely to achieve profits or losses similar to those shown; in fact, there are frequently sharp differences between hypothetical performance results and the actual results subsequently achieved by any particular trading program. One of the limitations of hypothetical performance results is that they are generally prepared with the benefit of hindsight. In addition, hypothetical trading does not involve financial risk, and no hypothetical trading record can completely account for the impact of financial risk of actual trading. for example, the ability to withstand losses or to adhere to a particular trading program in spite of trading losses are material points which can also adversely affect actual trading results. There are numerous other factors related to the markets in general or to the implementation of any specific trading program which cannot be fully accounted for in the preparation of hypothetical performance results and all which can adversely affect trading results.

Testimonial Disclosure: Testimonials appearing on this website may not be representative of other clients or customers and is not a guarantee of future performance or success.