Data &
Technology
Research
Reports
Report Solutions
Reports Library
Actionable
Strategies
Free
Resources
Simple Backtest Calculator
Simple Seasonality Calculator
The Kelly Criterion Calculator
Sentiment Geo Map
Public Research Reports
Free Webinar
Pricing
Company
About
Meet Our Team
In the News
Testimonials
Client Success Stories
Contact
Log inLoginSign up
< BACK TO ALL REPORTS

Small cap stocks near historic volatility extreme

Jason Goepfert
2021-03-31
Over the past 30 days, the small-cap Russell 2000 has been showing much higher volatility than the large-cap S&P 500. Over the past 40 years, this has happened only a handful of times, with smaller stocks ending up outperforming over the next 6 months.

Large-cap stocks, defined by the S&P 500, jumped to a record high on Friday. Other parts of the market, including small-caps, have been dragging.

Small-caps have a major influence on breadth statistics, a big reason why the S&P was meandering near an all-time high on Monday, yet breadth metrics were the worst in history.

Monday's activity was further evidence that volatility in those small-caps has jumped in recent weeks, even as the broader market stays relatively calm. Over the past 30 days, historical volatility in the Russell 2000 is now about 15 points higher than that for the S&P 500, one of the widest spreads in 40 years.

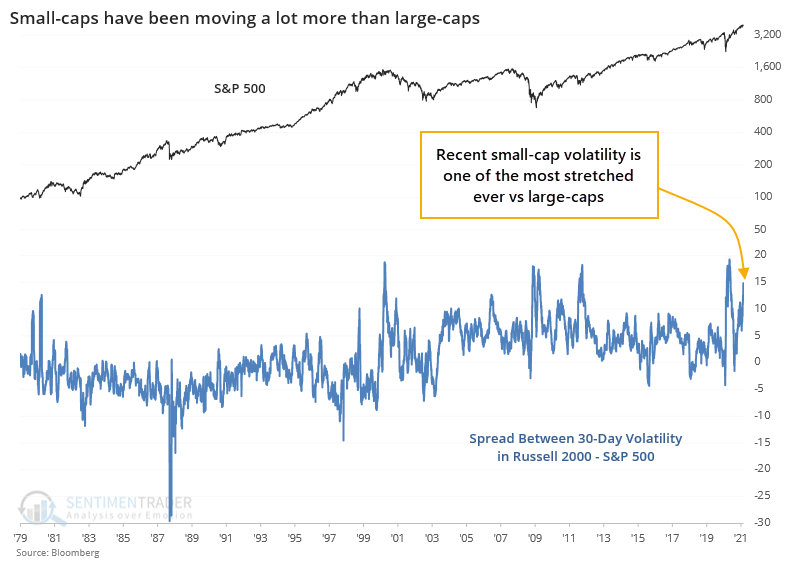
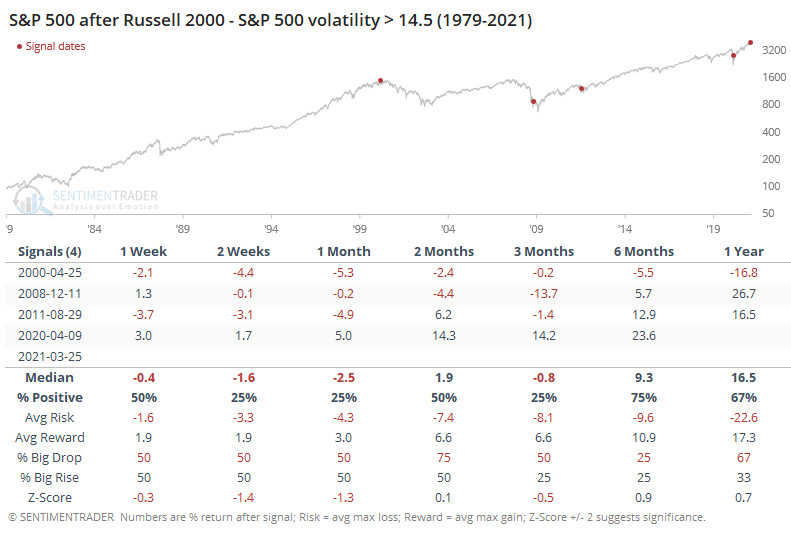
There aren't a whole lot of precedents for this kind of behavior since the inception of the Russell 2000 index. The handful of times that volatility between the two indexes reached the current level of extreme, the S&P didn't do so great going forward, excepting the last occurrence in the aftermath of the pandemic.

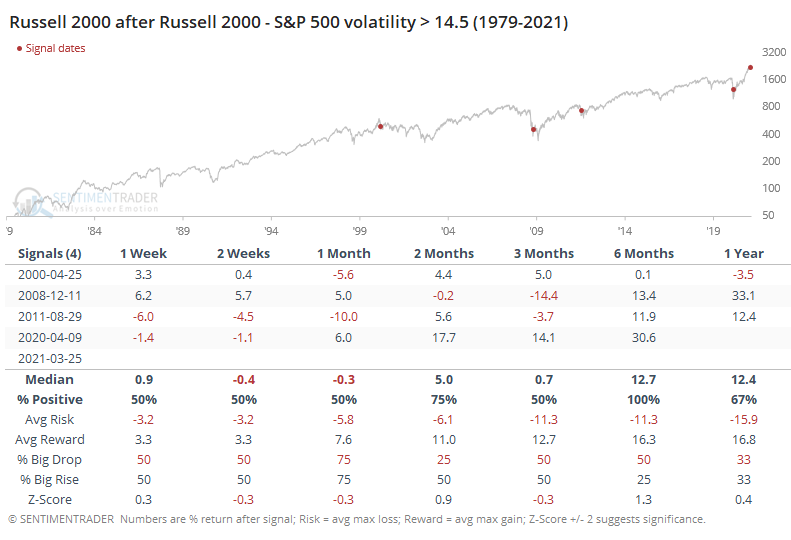
The Russell also showed mixed returns over the shorter-term, but at least by 6 months later showed a positive return each time.

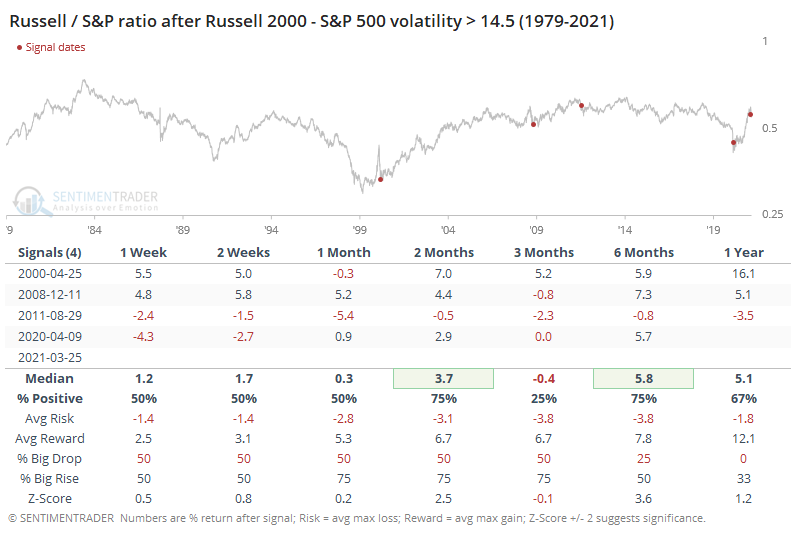
This means that the ratio of the Russell to S&P tended to rise as smaller stocks outperformed in the wake of their higher volatility. But it was a volatile ride.

To get a larger sample size, we have to lessen the threshold to a spread of 10 points. That gives us more history to work with to see if there's any solid conclusion here, but it also means that it's less applicable since the lesser extreme triggered nearly 3 months ago.

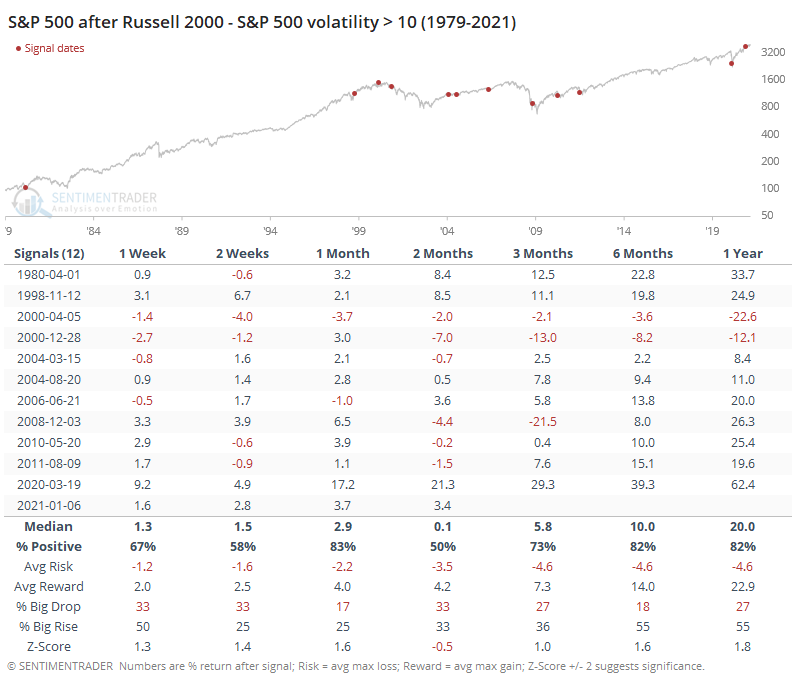
Again, the Russell tended to do better.

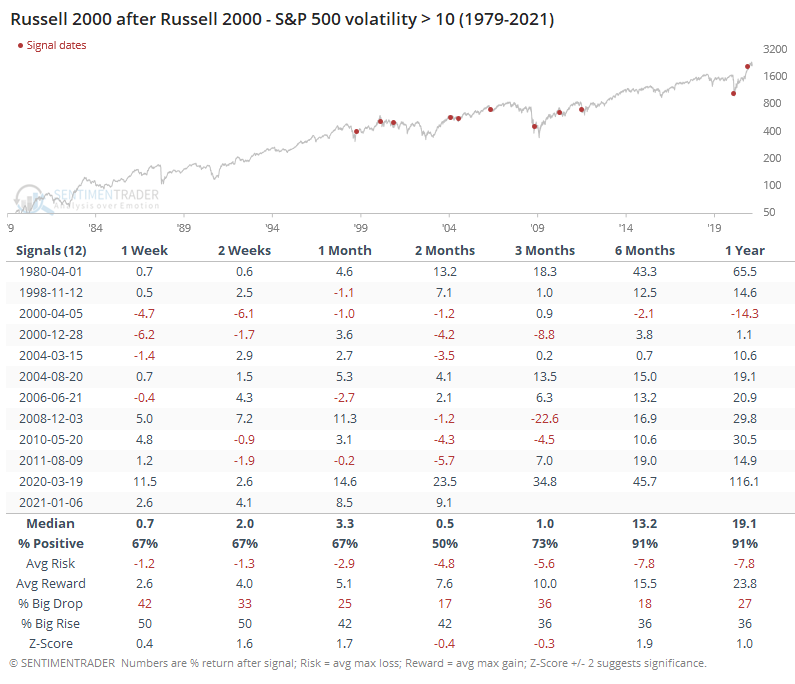
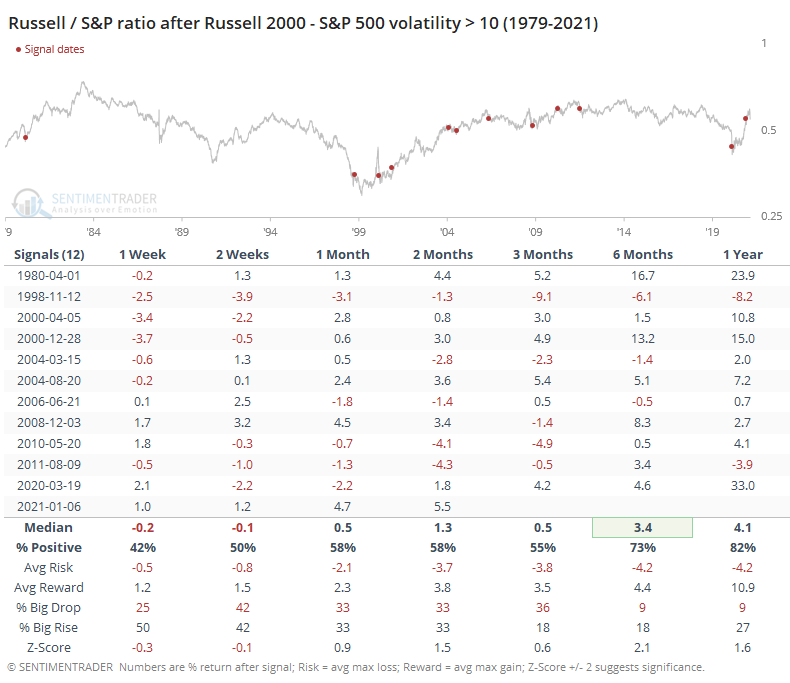
The ratio of the Russell to S&P was still volatile, but over the next 6 months, the disparity in favor of smaller stocks was especially wide.

As markets hit new highs and then become volatile, there is a tendency to think that it necessarily suggests a trend change. If overall levels of current and implied volatility start to persistently march higher, then the likelihood of a sustained decline becomes more probable. Currently, the simple fact that small-caps have been swinging so much more than large-caps isn't giving us too much of a hint that that's likely just yet, though.

Sorry, you don't have access to this report

Upgrade your subscription plan to get access
Go to Dasboard
DATA &
TECHnologies
IndicatorEdge
‍
BackTestEdge
‍
Other Tools
‍
DataEdge API
RESEARCH
reports
Research Solution
‍
Reports Library
‍
actionable
Strategies
Trading Strategies
‍
Smart Stock Scanner
‍
FREE
RESOUrCES
Simple Backtest
Calculator
Simple Seasonality
Calculator
The Kelly Criterion
Calculator
Sentiment Geo Map
‍
Public Research Reports
‍
Free Webinar
COMPANY
‍
About
‍
Meet our Team
‍
In the News
‍
Testimonials
‍
Client Success Stories
Pricing
Bundle pricing
‍
Announcements
‍
FAQ
© 2024 Sundial Capital Research Inc. All rights reserved.
Setsail Marketing
TermsPrivacyAffiliate Program
Risk Disclosure: Futures and forex trading contains substantial risk and is not for every investor. An investor could potentially lose all or more than the initial investment. Risk capital is money that can be lost without jeopardizing ones’ financial security or life style. Only risk capital should be used for trading and only those with sufficient risk capital should consider trading. Past performance is not necessarily indicative of future results.

Hypothetical Performance Disclosure: Hypothetical performance results have many inherent limitations, some of which are described below. No representation is being made that any account will or is likely to achieve profits or losses similar to those shown; in fact, there are frequently sharp differences between hypothetical performance results and the actual results subsequently achieved by any particular trading program. One of the limitations of hypothetical performance results is that they are generally prepared with the benefit of hindsight. In addition, hypothetical trading does not involve financial risk, and no hypothetical trading record can completely account for the impact of financial risk of actual trading. for example, the ability to withstand losses or to adhere to a particular trading program in spite of trading losses are material points which can also adversely affect actual trading results. There are numerous other factors related to the markets in general or to the implementation of any specific trading program which cannot be fully accounted for in the preparation of hypothetical performance results and all which can adversely affect trading results.

Testimonial Disclosure: Testimonials appearing on this website may not be representative of other clients or customers and is not a guarantee of future performance or success.