Data &
Technology
Research
Reports
Report Solutions
Reports Library
Actionable
Strategies
Free
Resources
Simple Backtest Calculator
Simple Seasonality Calculator
The Kelly Criterion Calculator
Sentiment Geo Map
Public Research Reports
Free Webinar
Pricing
Company
About
Meet Our Team
In the News
Testimonials
Client Success Stories
Contact
Log inLoginSign up
< BACK TO ALL REPORTS

Small Cap Stocks Haven't Done This Since 1933

Jason Goepfert
2021-07-15
The correlation between Small-Cap stocks and Growth stocks is at an 80-year low.

Investors are having a tough time keeping a grasp on things. So are we, with some of the oddest, whippiest few stretches in market history.

Stock indexes have been levitating at record highs, but there is a lot of tumult under the surface. Even within solid indexes like the S&P 500, a near-record low number of stocks are managing to hang onto their medium-term trends.

Some of the rotation has been vicious. Among sectors and factors, none is more evident than between Small-Cap stocks and Growth. Over the past year, the correlation between those two factors has plunged to the lowest since 1933.

Small cap correlation to growth

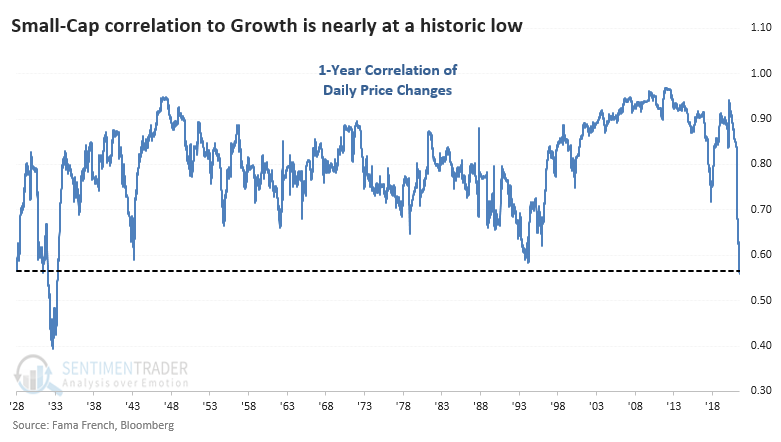
To a large extent, Growth = Technology, and we can see a similar plunge in that correlation. The rolling 1-year correlation between Small-Caps and Technology has just nosedived and is nearing its prior recent low from the end of 2017. 

Looking at Small-Caps' correlation to major sectors and factors, Growth and Technology rank at the bottom of the list, both in the bottom 10% of their all-time ranges. 

As for what it means for future returns, for the broader market, the answer was, "not much," but it did precede a consistent tendency for Small-Caps to do better than Technology over longer time frames.


What else we're looking at

  • Full returns in the S&P 500 following a plunge in Small-Cap correlation to Technology
  • What low correlations meant for future returns in Small-Caps, Tech, and the ratio between them
  • Among ETFs, the good, bad, and ugly in upcoming seasonal trends
  • Cyclical groups aren't confirming the S&P 500's recent highs - what to look for now

Stat box

While Small-Caps' correlation to Growth and Tech are plunging, they still have a +0.8 correlation to the Value factor (out of a scale from -1.0 to +1.0). That's their highest correlation to any sector or factor.

Etcetera

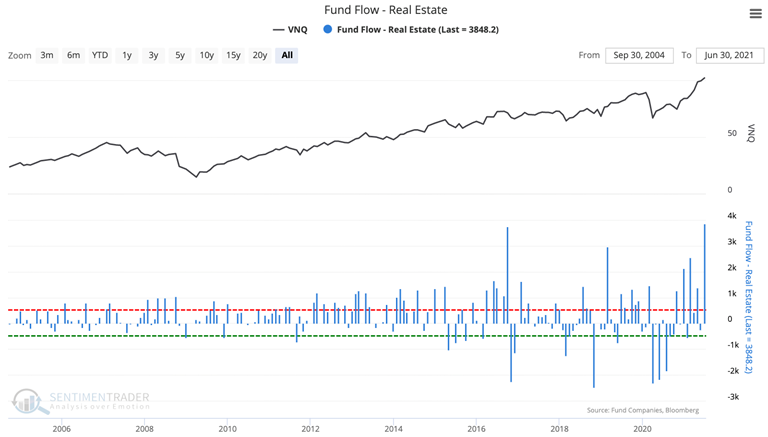
Big funds. In June, real estate ETFs absorbed their largest inflows in history, eclipsing the prior record from the fall of 2016.

real estate etf fund flow

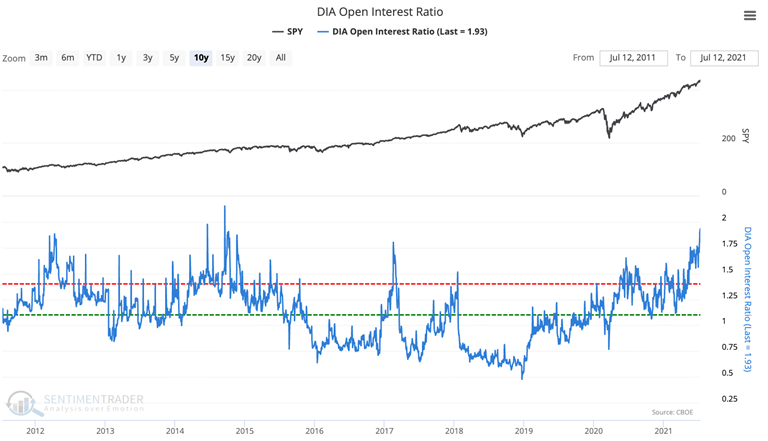
Put it here. There are now nearly 200 put option contracts outstanding for every 100 call options on the Dow Industrials ETF, DIA. That's the most in almost 7 years.

dow industrials dia put call open interest

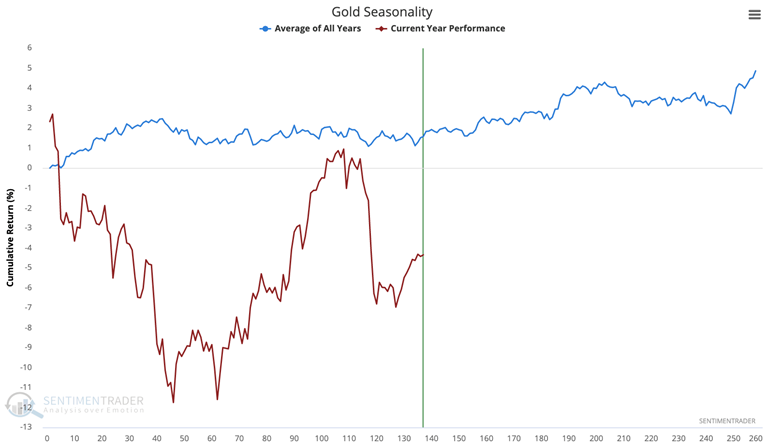
All that glitters. Average Gold Seasonality suggests that the yellow metal should rally from late summer into fall, but gold hasn't followed its typical seasonal fluctuations very closely in 2021.

gold seasonality

DATA &
TECHnologies
IndicatorEdge
‍
BackTestEdge
‍
Other Tools
‍
DataEdge API
RESEARCH
reports
Research Solution
‍
Reports Library
‍
actionable
Strategies
Trading Strategies
‍
Smart Stock Scanner
‍
FREE
RESOUrCES
Simple Backtest
Calculator
Simple Seasonality
Calculator
The Kelly Criterion
Calculator
Sentiment Geo Map
‍
Public Research Reports
‍
Free Webinar
COMPANY
‍
About
‍
Meet our Team
‍
In the News
‍
Testimonials
‍
Client Success Stories
Pricing
Bundle pricing
‍
Announcements
‍
FAQ
© 2024 Sundial Capital Research Inc. All rights reserved.
Setsail Marketing
TermsPrivacyAffiliate Program
Risk Disclosure: Futures and forex trading contains substantial risk and is not for every investor. An investor could potentially lose all or more than the initial investment. Risk capital is money that can be lost without jeopardizing ones’ financial security or life style. Only risk capital should be used for trading and only those with sufficient risk capital should consider trading. Past performance is not necessarily indicative of future results.

Hypothetical Performance Disclosure: Hypothetical performance results have many inherent limitations, some of which are described below. No representation is being made that any account will or is likely to achieve profits or losses similar to those shown; in fact, there are frequently sharp differences between hypothetical performance results and the actual results subsequently achieved by any particular trading program. One of the limitations of hypothetical performance results is that they are generally prepared with the benefit of hindsight. In addition, hypothetical trading does not involve financial risk, and no hypothetical trading record can completely account for the impact of financial risk of actual trading. for example, the ability to withstand losses or to adhere to a particular trading program in spite of trading losses are material points which can also adversely affect actual trading results. There are numerous other factors related to the markets in general or to the implementation of any specific trading program which cannot be fully accounted for in the preparation of hypothetical performance results and all which can adversely affect trading results.

Testimonial Disclosure: Testimonials appearing on this website may not be representative of other clients or customers and is not a guarantee of future performance or success.