Data &
Technology
Research
Reports
Report Solutions
Reports Library
Actionable
Strategies
Free
Resources
Simple Backtest Calculator
Simple Seasonality Calculator
The Kelly Criterion Calculator
Sentiment Geo Map
Public Research Reports
Free Webinar
Pricing
Company
About
Meet Our Team
In the News
Testimonials
Client Success Stories
Contact
Log inLoginSign up
< BACK TO ALL REPORTS

Small-cap stocks have rarely been this volatile (relatively)

Jason Goepfert
2021-04-01
Volatility in the small-cap Russell 2000 is nearing a record high compared to volatility in the large-cap S&P 500.

Large-cap stocks, defined by the S&P 500, jumped to a record high on Friday. Other parts of the market, including small-caps, have been dragging.

Small-caps have a major influence on breadth statistics, a big reason why the S&P was meandering near an all-time high on Monday, yet breadth metrics were the worst in history.

Monday's activity was further evidence that volatility in those small-caps has jumped in recent weeks, even as the broader market stays relatively calm. Over the past 30 days, historical volatility in the Russell 2000 is now about 15 points higher than that for the S&P 500, one of the widest spreads in 40 years.

Russell 2000 vs S&P 500 volatility

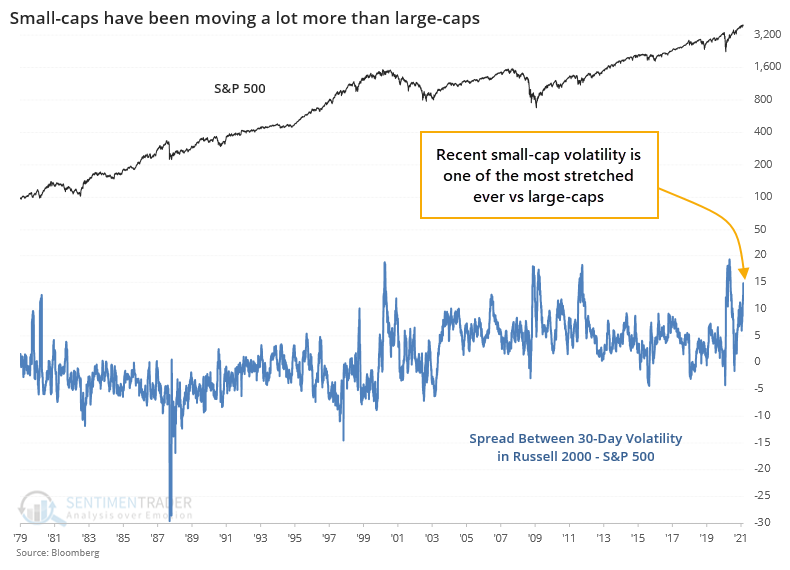
There aren't a whole lot of precedents for this kind of behavior since the inception of the Russell 2000 index. The handful of times that volatility between the two indexes reached the current level of extreme, the S&P didn't do so great going forward, excepting the last occurrence in the aftermath of the pandemic.

What else we're looking at

  • Detailed returns in the S&P, Russell, and the ratio between them, when the volatility spread was wide
  • A Risk On / Risk Off measure using the bond market has switched it signal for April
  • An update on a recent volatility signal shows an interesting return
  • The past 2 weeks have seen some unusual internal activity

Stat Box

Over the past 10 days, the S&P 500 has flirted with record highs, but the McClellan Oscillator has been negative all 10 days. Two-week stretches like this have happened 21 other times over the past 60 years.


Etcetera

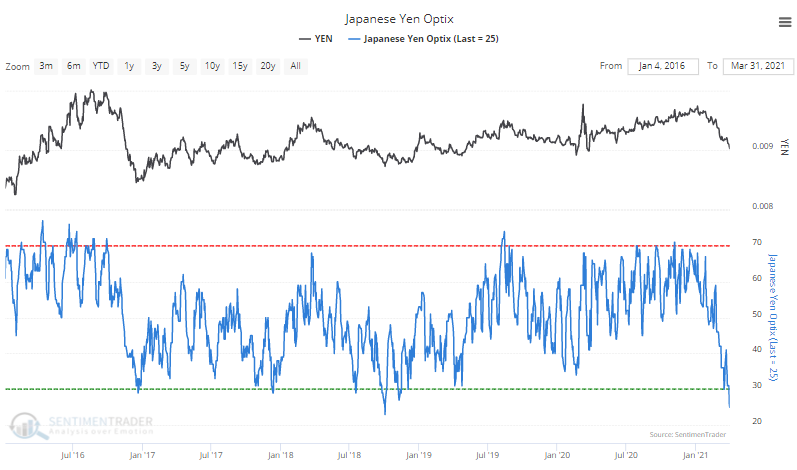
A lot of yen bears. Sentiment on the Japanese yen has plunged in recent weeks. The Optimism Index on the currency is now at its 2nd-lowest point in the past 5 years.

japanese yen sentiment

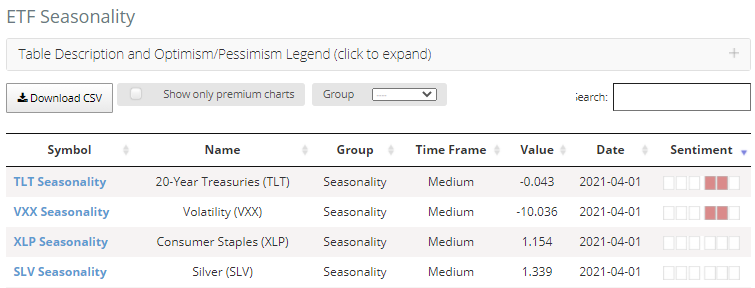
A month of tailwinds. Among 46 ETFs for which we track seasonal trends, only 2 of them - TLT and VXX - show a negative bias for April.

april etf seasonality

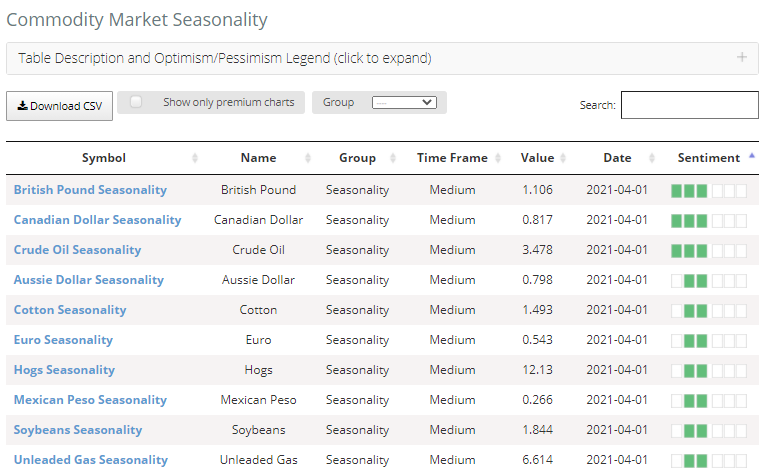
For most commodities, too. As we enter the new month, most currency and commodity futures also show a positive bias, among the most positive being commodity currencies like the Aussie and Canadian dollars.

april commodity seasonality

DATA &
TECHnologies
IndicatorEdge
‍
BackTestEdge
‍
Other Tools
‍
DataEdge API
RESEARCH
reports
Research Solution
‍
Reports Library
‍
actionable
Strategies
Trading Strategies
‍
Smart Stock Scanner
‍
FREE
RESOUrCES
Simple Backtest
Calculator
Simple Seasonality
Calculator
The Kelly Criterion
Calculator
Sentiment Geo Map
‍
Public Research Reports
‍
Free Webinar
COMPANY
‍
About
‍
Meet our Team
‍
In the News
‍
Testimonials
‍
Client Success Stories
Pricing
Bundle pricing
‍
Announcements
‍
FAQ
© 2024 Sundial Capital Research Inc. All rights reserved.
Setsail Marketing
TermsPrivacyAffiliate Program
Risk Disclosure: Futures and forex trading contains substantial risk and is not for every investor. An investor could potentially lose all or more than the initial investment. Risk capital is money that can be lost without jeopardizing ones’ financial security or life style. Only risk capital should be used for trading and only those with sufficient risk capital should consider trading. Past performance is not necessarily indicative of future results.

Hypothetical Performance Disclosure: Hypothetical performance results have many inherent limitations, some of which are described below. No representation is being made that any account will or is likely to achieve profits or losses similar to those shown; in fact, there are frequently sharp differences between hypothetical performance results and the actual results subsequently achieved by any particular trading program. One of the limitations of hypothetical performance results is that they are generally prepared with the benefit of hindsight. In addition, hypothetical trading does not involve financial risk, and no hypothetical trading record can completely account for the impact of financial risk of actual trading. for example, the ability to withstand losses or to adhere to a particular trading program in spite of trading losses are material points which can also adversely affect actual trading results. There are numerous other factors related to the markets in general or to the implementation of any specific trading program which cannot be fully accounted for in the preparation of hypothetical performance results and all which can adversely affect trading results.

Testimonial Disclosure: Testimonials appearing on this website may not be representative of other clients or customers and is not a guarantee of future performance or success.