Data &
Technology
Research
Reports
Report Solutions
Reports Library
Actionable
Strategies
Free
Resources
Simple Backtest Calculator
Simple Seasonality Calculator
The Kelly Criterion Calculator
Sentiment Geo Map
Public Research Reports
Free Webinar
Pricing
Company
About
Meet Our Team
In the News
Testimonials
Client Success Stories
Contact
Log inLoginSign up
< BACK TO ALL REPORTS

Small Cap Stocks Have Only Done This Once in 40 Years

Jason Goepfert
2021-09-29
The small-cap Russell 2000 index has gone more than 135 days without setting a new high, but also hasn't suffered a correction.

The small-cap Russell 2000 hasn't gone anywhere for six months. On Monday, we noted that these stocks peaked when options traders' speculative fervor did, and these stocks have been trying to shrug off the hangover ever since.

The Russell has gone more than 135 days without a 52-week high, yet it was down less than 10% at its worst point. Even though it's been six months, it hasn't even suffered the standard definition of a correction.

Small cap Russell 2000 trading range

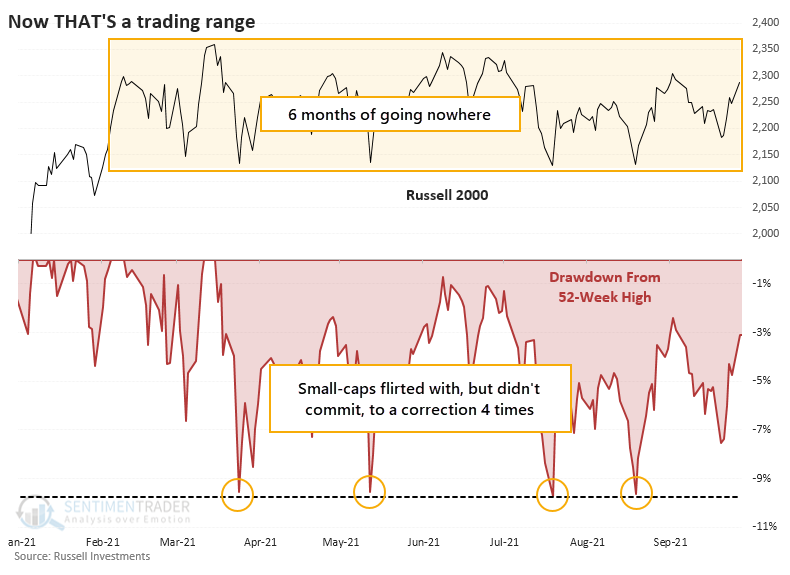
Time-wise, this is one of the longer stretches between 52-week highs, but by no means the longest. It went more than two years without one during the last two protracted bear markets.

It's unusual that the index has gone so long without a new high but didn't even suffer a 10% pullback along the way. Only one other stretch in the history of the Russell 2000 can claim this. That was almost exactly seven years ago, which quickly saw small-cap stocks lose a lot more in the weeks ahead before popping back up again.


What else we're looking at

  • Full returns in the Russell 2000 after long stretches without a new high, and without a deep pullback
  • A look at small-caps' internal breadth and what it suggests going forward
  • What utilities' losing streak means for the sector...and the broader stock and bond markets
  • A look at oil's seasonal tendencies heading into winter

Stat box

For the first time since June, 100% of energy stocks are now trading above their 50-day moving averages.

Etcetera

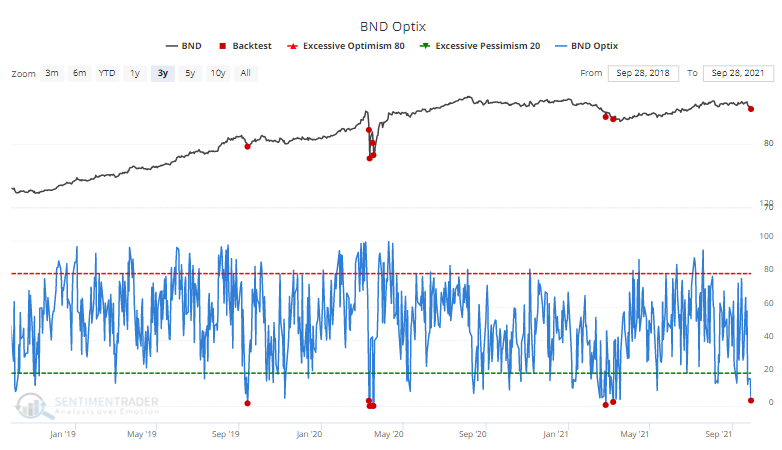
Bond bears. Heavy selling pressure across the bond market pushed the Optimism Index for the broad-based BND fund below 3.5%. That's one of the lowest readings in the past 3 years.

bnd bond sentiment

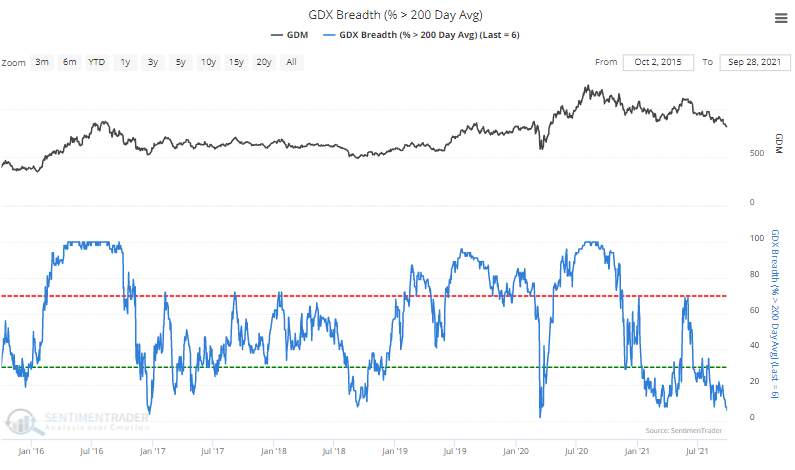
Precious few uptrends. Only 6% of gold mining stocks are trading above their 200-day moving averages, one of the lowest amounts since the stocks bottomed in 2016.

gdx gold miners above 200 day moving average

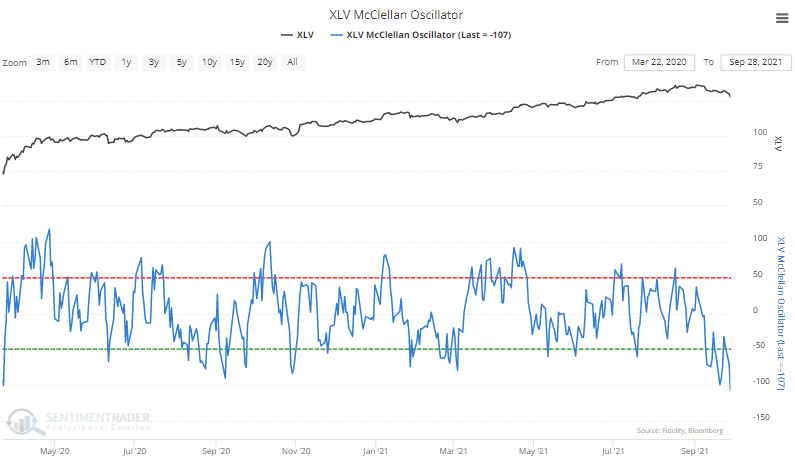
Deep dive. The McClellan Oscillator, a measure of internal breadth momentum, has cratered for Health Care stocks. For the XLV fund, this is the lowest Oscillator since the pandemic bottom.

xlv health care mcclellan oscillator

DATA &
TECHnologies
IndicatorEdge
‍
BackTestEdge
‍
Other Tools
‍
DataEdge API
RESEARCH
reports
Research Solution
‍
Reports Library
‍
actionable
Strategies
Trading Strategies
‍
Smart Stock Scanner
‍
FREE
RESOUrCES
Simple Backtest
Calculator
Simple Seasonality
Calculator
The Kelly Criterion
Calculator
Sentiment Geo Map
‍
Public Research Reports
‍
Free Webinar
COMPANY
‍
About
‍
Meet our Team
‍
In the News
‍
Testimonials
‍
Client Success Stories
Pricing
Bundle pricing
‍
Announcements
‍
FAQ
© 2024 Sundial Capital Research Inc. All rights reserved.
Setsail Marketing
TermsPrivacyAffiliate Program
Risk Disclosure: Futures and forex trading contains substantial risk and is not for every investor. An investor could potentially lose all or more than the initial investment. Risk capital is money that can be lost without jeopardizing ones’ financial security or life style. Only risk capital should be used for trading and only those with sufficient risk capital should consider trading. Past performance is not necessarily indicative of future results.

Hypothetical Performance Disclosure: Hypothetical performance results have many inherent limitations, some of which are described below. No representation is being made that any account will or is likely to achieve profits or losses similar to those shown; in fact, there are frequently sharp differences between hypothetical performance results and the actual results subsequently achieved by any particular trading program. One of the limitations of hypothetical performance results is that they are generally prepared with the benefit of hindsight. In addition, hypothetical trading does not involve financial risk, and no hypothetical trading record can completely account for the impact of financial risk of actual trading. for example, the ability to withstand losses or to adhere to a particular trading program in spite of trading losses are material points which can also adversely affect actual trading results. There are numerous other factors related to the markets in general or to the implementation of any specific trading program which cannot be fully accounted for in the preparation of hypothetical performance results and all which can adversely affect trading results.

Testimonial Disclosure: Testimonials appearing on this website may not be representative of other clients or customers and is not a guarantee of future performance or success.