
Six-Month Analogs With Record Momentum Shift

This is an abridged version of our Daily Report.
Six-month comparisons
Looking at analog comparisons of different time periods is fraught with data-mining risk, but they can still prove useful in some contexts. Looking at how stocks have traveled since August, there have been 26 six-month time periods since 1928 that have a high correlation to what we’ve seen over the past six months.
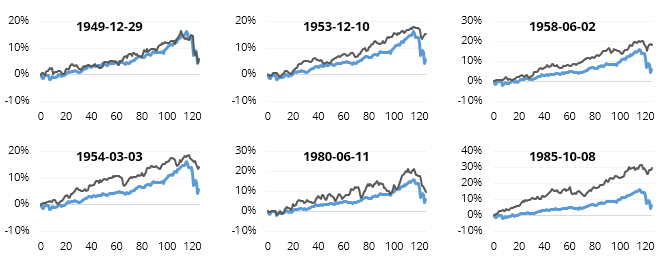
Over the following six months, most of those led to gains in stocks with only 1 loss of significance in six months.
A record shift in momentum
Heading into January, we looked at the market’s momentum via the Relative Strength Index several times, which almost invariably led to long-term gains. The S&P’s RSI has now cycled from overbought to oversold in the fewest days ever.
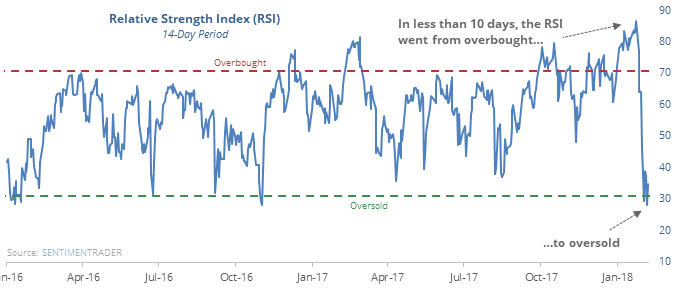
That raises concern that we’re now in a different market environment. That doesn’t necessarily mean losses ahead, as other quick cycles led to gains almost every time.
Someone got worried
The Equity Hedging Index rose above 70 during the past week, the highest level since February 2016. According to the Backtest Engine, when the model was above 70, the S&P showed a positive return over the next two months after 62 out of 70 weeks.
Blastoff
The S&P was sitting at a 50-day low in a bull market a couple of days ago then surged more than 1% on consecutive days.
For access to the full report, indicators, charts, screens, and Backtest Engine, log in or sign up for a free 30-day trial today.