
Signs of the apocalypse

Stock prices are stretched, their valuations are absurd, and investors are all-in.
So notes money manager John Hussman in a recent post outlining the dangers that investors are currently facing. As he states:
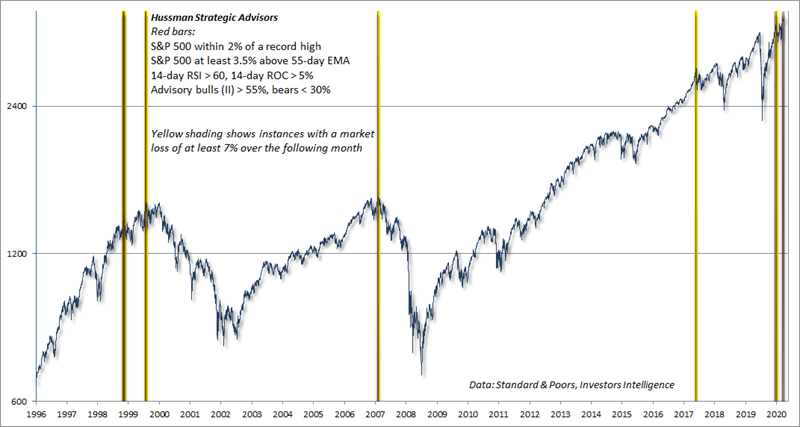
"The red bars in the chart below show one of the more extreme syndromes of “overvalued, overbought, overbullish” conditions one can define. The specific conditions are shown in the chart text. The bars with yellow shading show instances where this syndrome has been in place, and the S&P 500 dropped at least 7% over the following month. All of these instances, prior to those of the past few days, are shaded yellow."
The first time in recent years that we discussed Mr. Hussman's work was February 2016, when he was warning of the conditions that precede market crashes. As we saw at the time, those assertions typically did not lead to crashes; stocks rallied most of the time. Same goes for August 2017. And then again in March 2019. As anyone who is familiar with Mr. Hussman's work knows, there is a pattern there.
Regarding his latest warning, the criteria that have preceded big declines include:
- The S&P 500 is within 2% of a 52-week high
- It is at least 3.5% above its 55-day exponential moving average
- Its 14-day Relative Strength Index is > 60%
- Its 14-day rate of change is > 5%
- Investor's Intelligence survey bulls are > 55%
- Investor's Intelligence survey bears are < 30%
We should all be immediately triggered by the use of super-specific conditions and a lot of them. Regardless, if we look objectively at every instance when all of these criteria were met, then we can see the S&P 500's forward returns below.
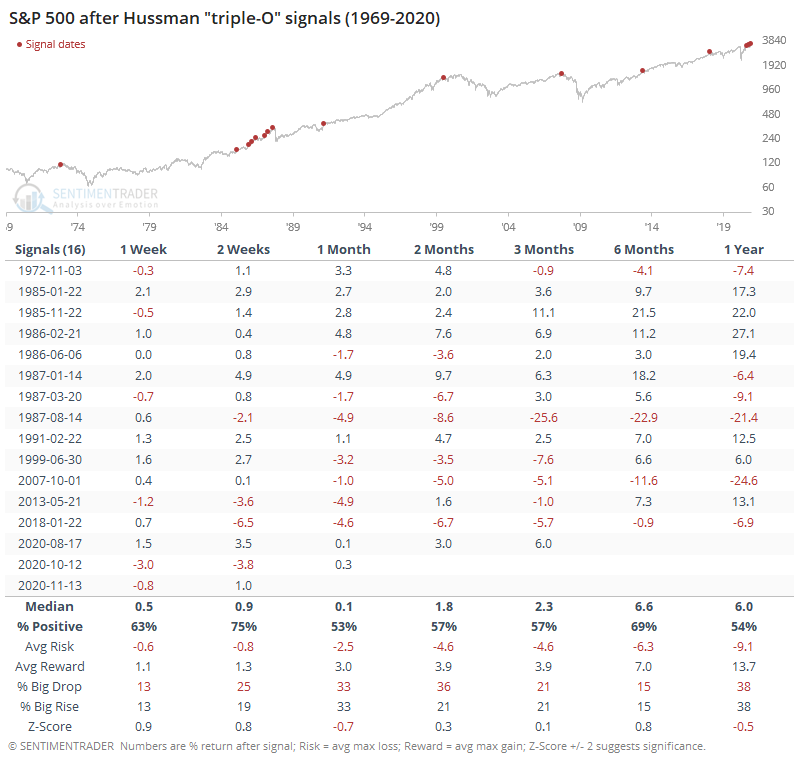
Certainly, a few of them preceded big declines. These combinations of factors preceded big drops in stocks in 1973, 1987, 2001, 2008, and 2018. But we shouldn't cherry-pick the ones that look ugly on a chart. When we consider all of them together with what we would have known at the time, we would have missed out on more gains than we would have saved by avoiding the relatively few losers. The probability of a big rise across most time frames was about the same as that of a big drop.
An article by Bloomberg sounded some similarly cautious notes. It, too, shows that stocks are overvalued, prices are stretched, and investors are overly confident.
The piece points out 5 potential warning signs:
- The S&P 500 is above its monthly Bollinger Band
- The put/call ratio is at a 20-year low
- Almost all stocks are already in uptrends
- Tech stocks are more than 2 standard deviations above trend
- The P/E ratio is historically stretched
If we normalize all of these factors, comparing each day's reading with its lifetime range, then we can get a sense of whether these conditions have ever happened before.
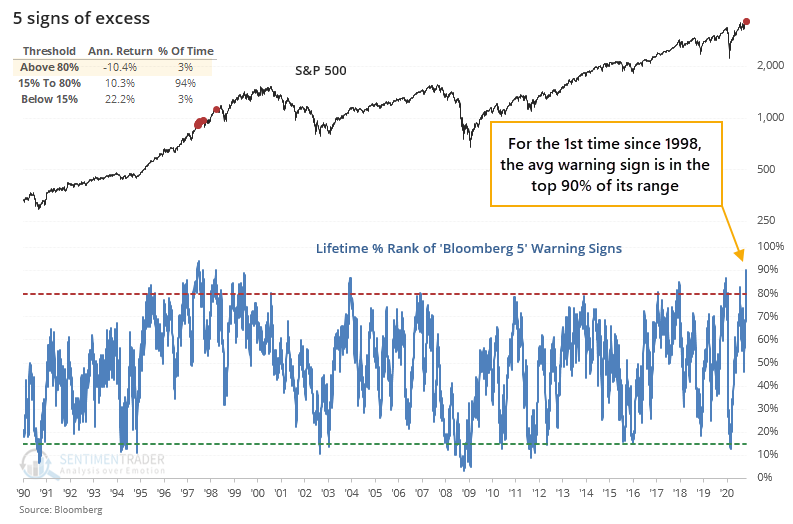
From the chart, we can see that this is the 1st time since 1998 when the average of the 5 warning signs was in the top 90% of its lifetime range. Below, we can see that the S&P struggled to hold its gains for the first few months after this moved above 90%.
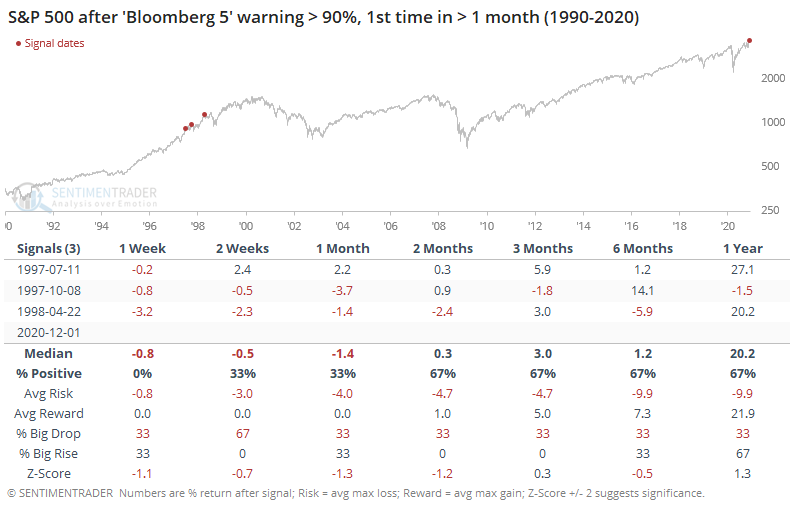
Stocks did drop after this threshold was first breached, but the losses were pretty minimal. And over the next 6 or 12 months, each of the signals showed a positive return.
If we relax the upper threshold to 80% to generate a larger sample size, then there were still some shorter-term tough spots, but it wasn't as ominous of a medium-term warning.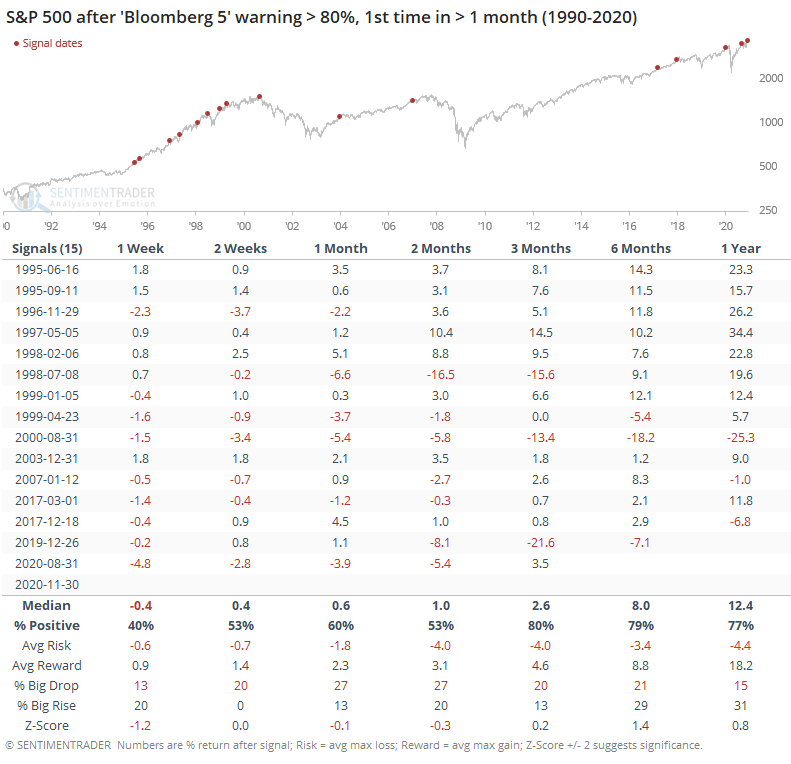
These conditions didn't lead to the best returns going forward, with below-average results up to 2 months later. From 3 months and beyond, however, the S&P's average returns were well above random, with a decent risk/reward skew.
Conditions like we're seeing now should be worrisome to new, or particularly aggressive, investors. Forward returns have a tendency to be muted, with further short-term gains likely to be erased at some point in the following months. A few of them have even morphed into honest-to-goodness bear markets. But it's not nearly as consistent as the loudest voices tend to assert - the most common outcome is mediocre returns accompanied by choppy market conditions. Perhaps a warning, yes, but not a sell signal.