
Signs of a thaw remain elusive

A little over a week ago, we looked at signs outside of the major stock indexes to see how the nascent recovery was progressing. Other than the thrust in stocks, the signs weren't very convincing. They're still not.
The most compelling development over the past few weeks has been the historic level of selling pressure, then the buying thrust and quick retracement of the decline in major indexes like the S&P 500. When we've seen combinations like this in the past, it has led to even higher prices with great consistency. We'd still place the most weight on those factors.
It would just be nice to see other markets recover in line or better than the S&P, though. Seeing them lag continuously makes the whole recovery seem suspect. Below, we'll go over most of the same charts as we did last week.
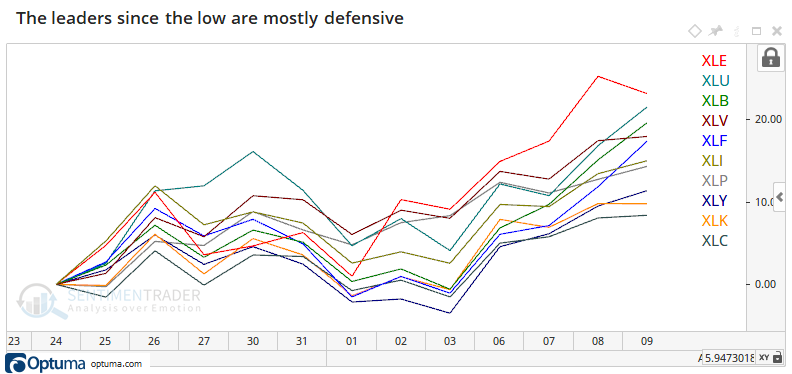
In terms of leading sectors, they continue to be defensive. This isn't a great sign - most "true" bottoms saw more cyclical stocks leading the initial thrust out of the low.
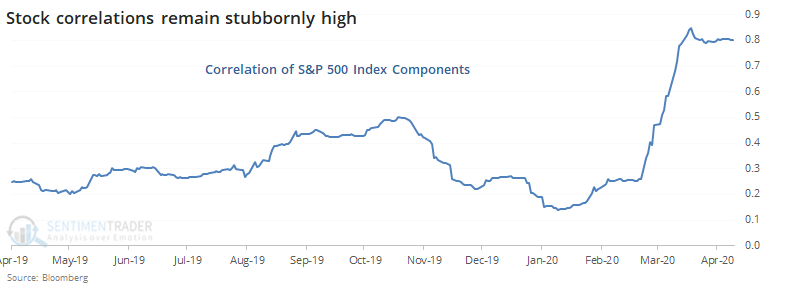
There still hasn't been much of a relaxation in the correlation among stocks. Most are rising and falling together, not trading on their own merits.
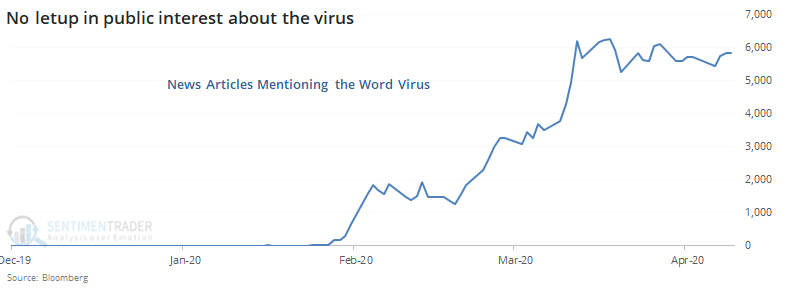
The virus remains forefront in the public mind. As long as editors see demand from their readers for articles about the virus, they'll be published.
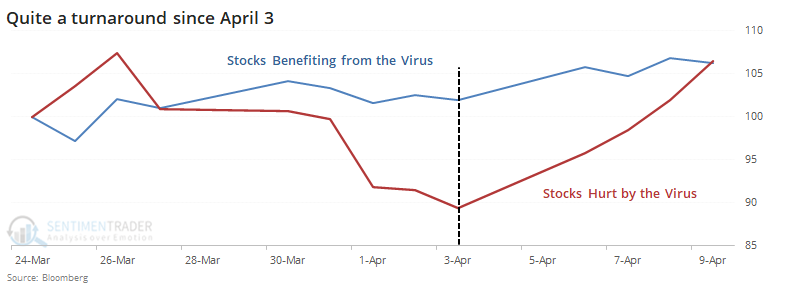
Stocks hurt by the virus are trying to make a higher high but struggling. Those benefiting from it keep rising and have nearly hit new highs.
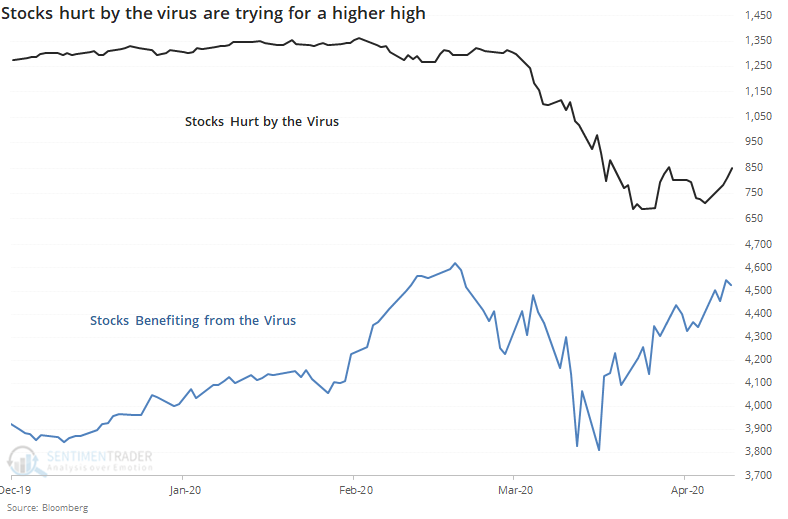
A minor good sign is that since April 3, the gap has narrowed, and the "hurt" stocks have soared. This needs to continue.
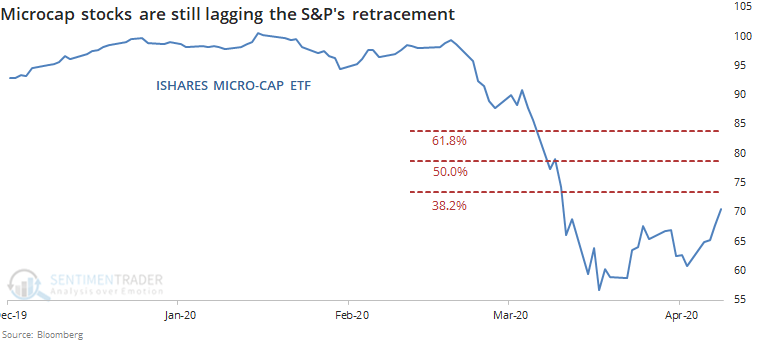
Among the worst hit were micro-cap stocks. They still haven't retraced much of their decline.
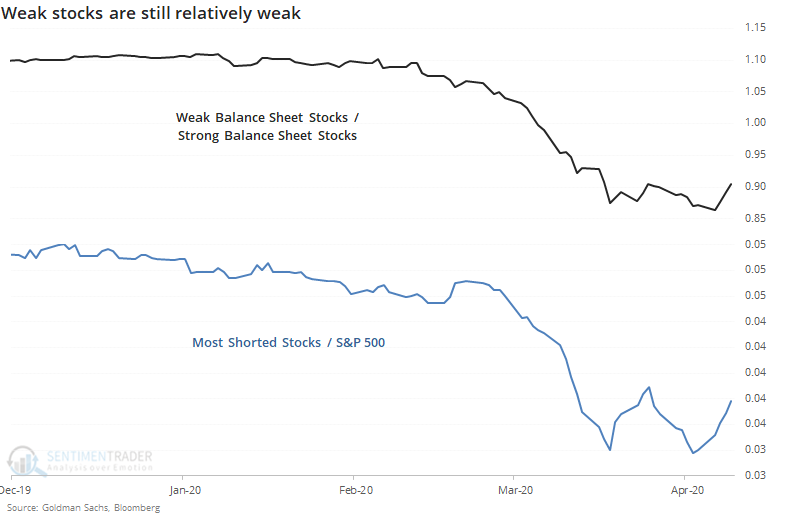
Neither have fundamentally weak and/or shorted stocks. They're still showing a pattern of lower highs and lows.
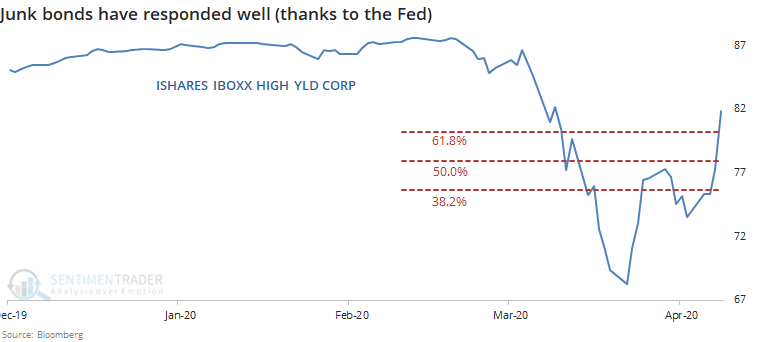
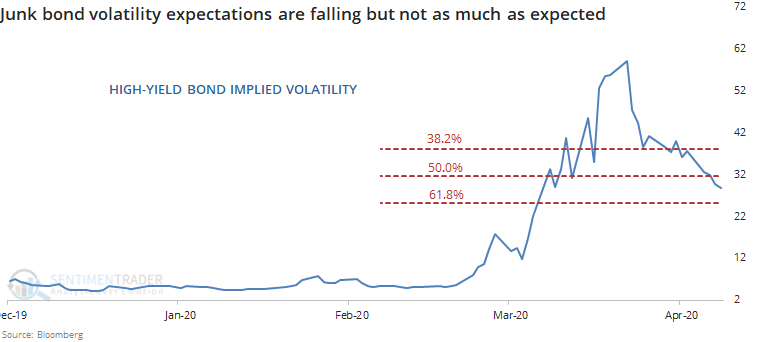
The biggest outlier here is junk bonds. They've soared, thanks to the new Fed program announced on Thursday.
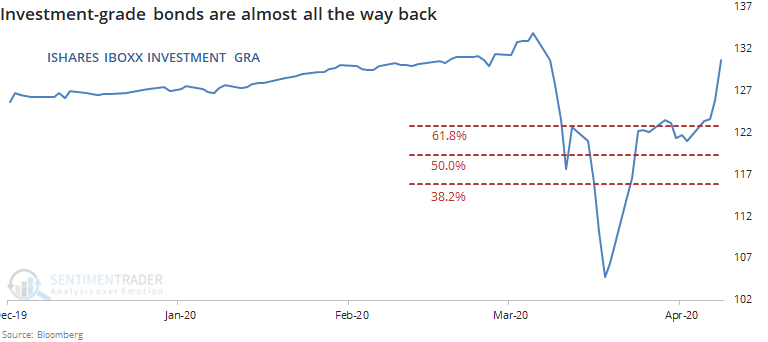
Investment-grade bonds are nearly back to their old highs. It's hard to argue this is a negative.
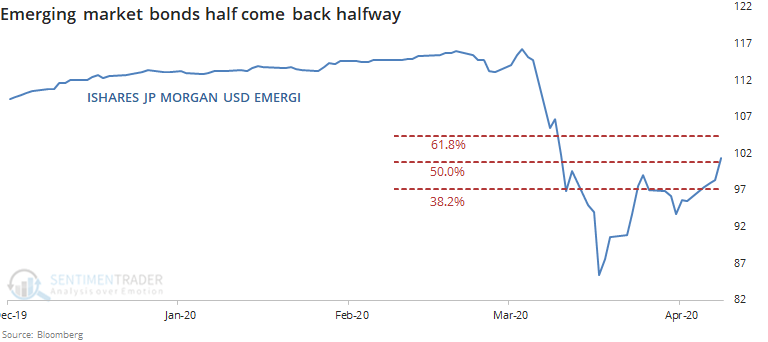
Even emerging market bonds are doing okay, retracing about as much of their decline as the S&P 500 has.
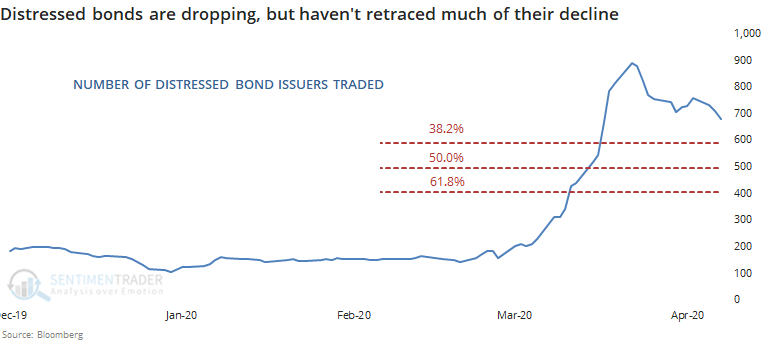
The number of bond issuers classified as distressed is dropping, but not by much. It's down a couple of hundred from the peak, which isn't saying a whole lot given how much of a spike there was.
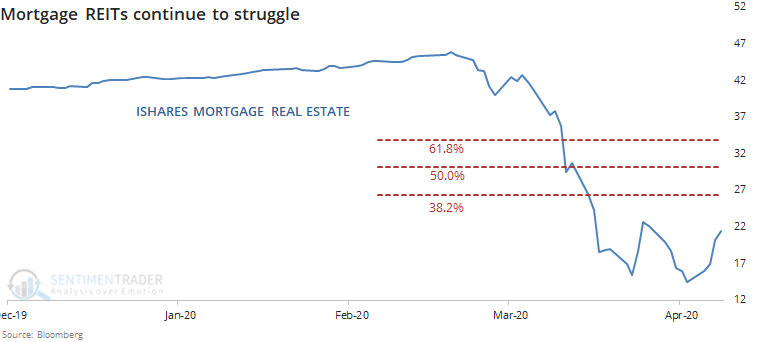
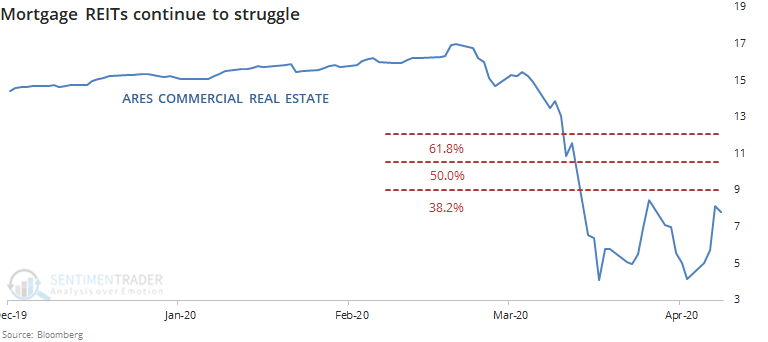
According to some, mortgage REITs are the canary in the coal mine if this whole thing is going to turn into a prolonged crisis. And so far, their bounces have been uninspiring.
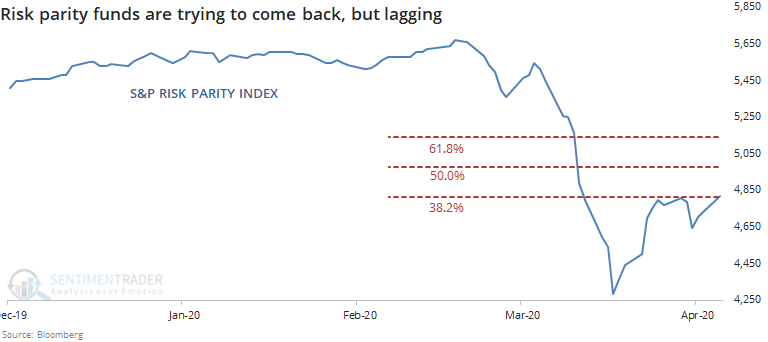
While funds employing "black swan" strategies made up years worth of losses when volatility spiked, risk parity funds suffered the opposite fate. This is another corner of the market where some think we could see systemic risk, but so far they've been bouncing and doing okay.
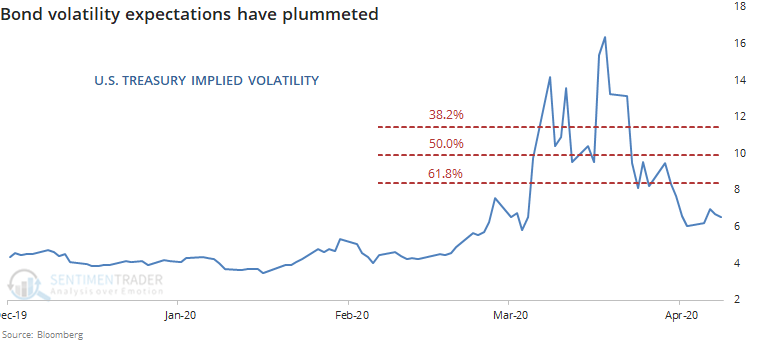
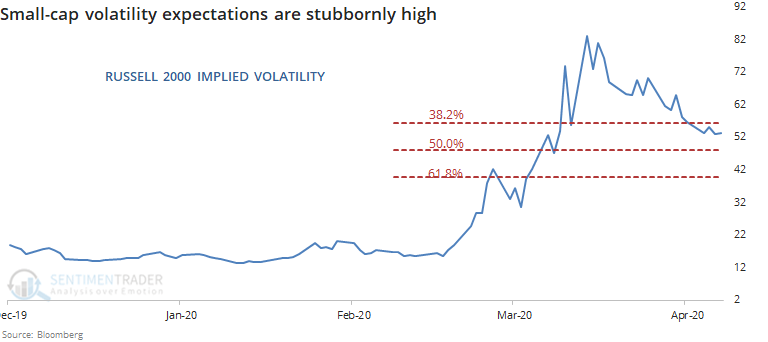
We should see traders more and more willing to price in lower volatility expectations as a recovery takes hold, and we have.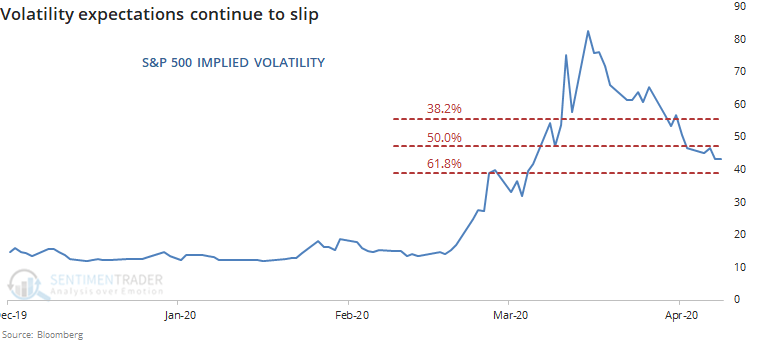
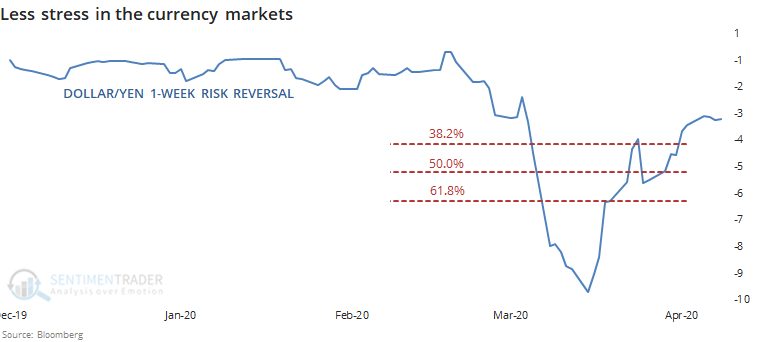
One of the signs of stress at the height of the panic was demand for dollars, and the dollar/yen risk reversal exploded like it did in 2008. Traders would not want to see this widen out again, and so far it's been contained.
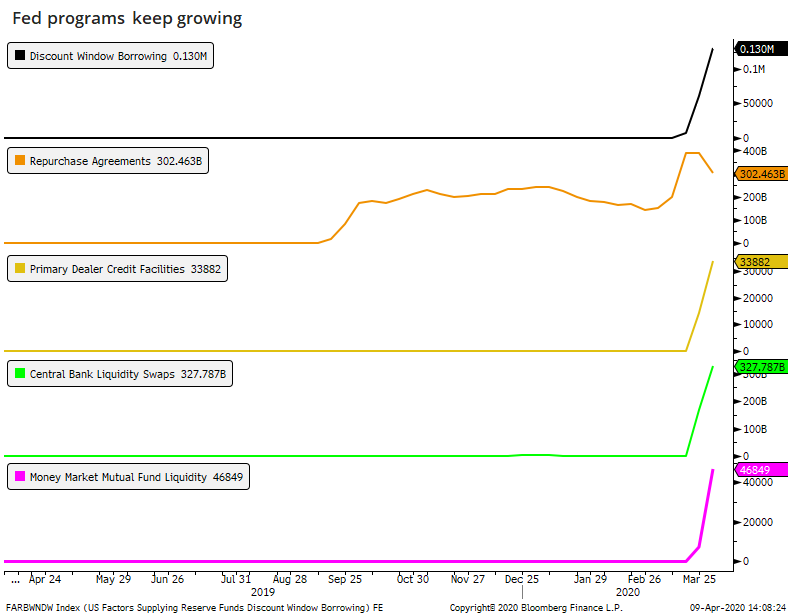
In a surprise to no one, there is still demand for the Fed's newly introduced programs. This will be the case for weeks, maybe even months, but bulls should like to see this peak sooner rather than later.
Overall, there is little here that screams "bullish," unlike a lot of the breadth stuff we've looked at. Most corners of the market are recovery, it's just not very convincing. It would be easier to have more faith in the idea of a recovery if it broadened out and signs of stress in the most exposed corners eased more than they have.