Data &
Technology
Research
Reports
Report Solutions
Reports Library
Actionable
Strategies
Free
Resources
Simple Backtest Calculator
Simple Seasonality Calculator
The Kelly Criterion Calculator
Sentiment Geo Map
Public Research Reports
Free Webinar
Pricing
Company
About
Meet Our Team
In the News
Testimonials
Client Success Stories
Contact
Log inLoginSign up
< BACK TO ALL REPORTS

Signs of a thaw in the crisis

Jason Goepfert
2020-03-31
We take a look at some indicators showing a thaw (or lack thereof) in the crisis. More and more indexes are showing stocks with MACD buy signals.

Looking for a thaw in the crisis

Because equities make up the bulk of most investors' allocation, they get most of the attention, as they should. And most use the S&P 500 as the benchmark against which their allocation is measured, which also makes sense. That's why we spend most of our time using that particular index and its components.

The last few weeks have caused a tsunami of volatility, but not just in stocks. We've already looked at how it has caused a rift across bonds, currencies and commodities.

As stocks try to recover, perhaps we can look beyond the usual equity metrics and see if there are any signs that this recovery is for real. The most compelling development so far is the buying thrust from last week, and the bigger-than-usual retracement of the decline.

Because the news flow has been so horrid, and most of us have to actively seek out good news, it would make sense to see stocks that have been struck hard by the virus continue to struggle. If those stocks rebound harder than the market - while those stocks enjoying a panic bump start to peak - then it would also indicate that fear is ebbing.

Not much sign of that yet. Stocks hit hard by the virus are continuing to lag. It seems crass to talk about stocks benefiting from this disaster, but some truly have, and they're not showing much sign of letting up yet.

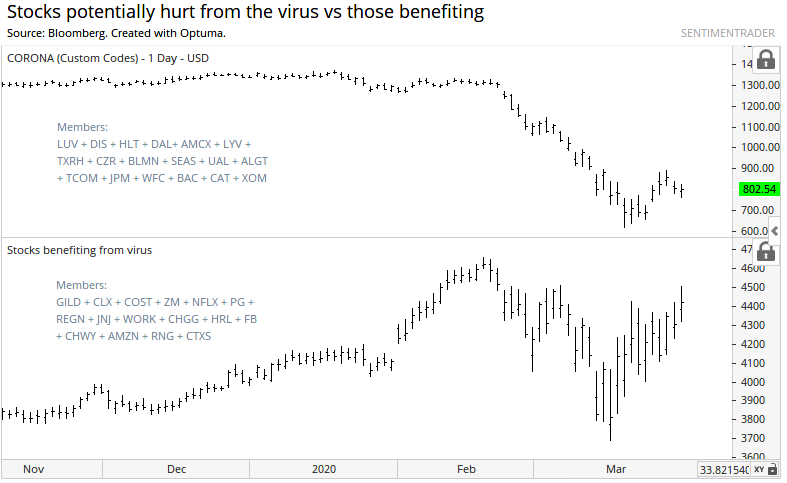
If this rally is for real, we should see more of a reversal between these two groups of stocks.

When we take a look at other indicators covering various markets, we can see that there is still not a solid sign of a recovery from the panic.


Stocks with buy signals

Last week we started pointing out that an extremely large percentage of stocks have triggered MACD buy signals over the past 10 days, which is a bullish sign for stocks. That figure in many countries has now shattered historical records and is at an all-time high. This is certainly one for the history books.

For example, more than 88% of S&P 500 stocks have now triggered buy signals. This is by a far a record, shattering anything we saw at the 2002, 2008-2009, 2011, and 2018 market bottoms.

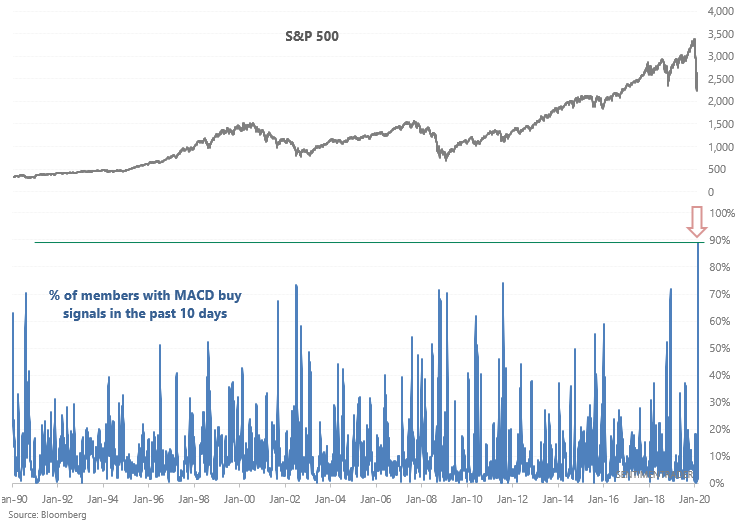
It's also true for other indexes we're looking at, both in the U.S. and overseas, and they all have impressive and compelling precedents. For more information on the MACD, see this post.

This is an abridged version of our recent reports and notes. For immediate access with no obligation, sign up for a 30-day free trial now.

We also looked at:

  • Many other indicators of a potential thaw in the crisis, like correlations, news flow, and credit trends
  • The S&P suffered a Death Cross - we look at historical similarities, as well as across sectors and stocks
  • A more in-depth look at some of the MACD buy signals
  • The stock/bond ratio is bouncing back
  • Margin debt keeps dropping
DATA &
TECHnologies
IndicatorEdge
‍
BackTestEdge
‍
Other Tools
‍
DataEdge API
RESEARCH
reports
Research Solution
‍
Reports Library
‍
actionable
Strategies
Trading Strategies
‍
Smart Stock Scanner
‍
FREE
RESOUrCES
Simple Backtest
Calculator
Simple Seasonality
Calculator
The Kelly Criterion
Calculator
Sentiment Geo Map
‍
Public Research Reports
‍
Free Webinar
COMPANY
‍
About
‍
Meet our Team
‍
In the News
‍
Testimonials
‍
Client Success Stories
Pricing
Bundle pricing
‍
Announcements
‍
FAQ
© 2024 Sundial Capital Research Inc. All rights reserved.
Setsail Marketing
TermsPrivacyAffiliate Program
Risk Disclosure: Futures and forex trading contains substantial risk and is not for every investor. An investor could potentially lose all or more than the initial investment. Risk capital is money that can be lost without jeopardizing ones’ financial security or life style. Only risk capital should be used for trading and only those with sufficient risk capital should consider trading. Past performance is not necessarily indicative of future results.

Hypothetical Performance Disclosure: Hypothetical performance results have many inherent limitations, some of which are described below. No representation is being made that any account will or is likely to achieve profits or losses similar to those shown; in fact, there are frequently sharp differences between hypothetical performance results and the actual results subsequently achieved by any particular trading program. One of the limitations of hypothetical performance results is that they are generally prepared with the benefit of hindsight. In addition, hypothetical trading does not involve financial risk, and no hypothetical trading record can completely account for the impact of financial risk of actual trading. for example, the ability to withstand losses or to adhere to a particular trading program in spite of trading losses are material points which can also adversely affect actual trading results. There are numerous other factors related to the markets in general or to the implementation of any specific trading program which cannot be fully accounted for in the preparation of hypothetical performance results and all which can adversely affect trading results.

Testimonial Disclosure: Testimonials appearing on this website may not be representative of other clients or customers and is not a guarantee of future performance or success.