
Should we buy the oversold condition part 2

Key points:
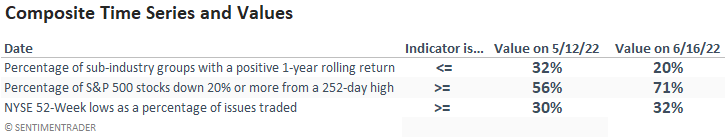
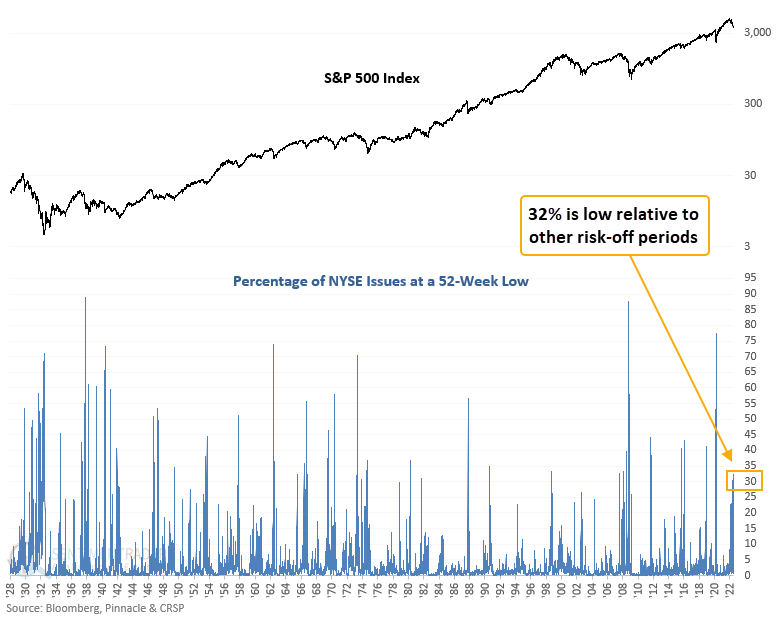
- 52-Week lows for NYSE issues surged above 32%
- More than 71% of S&P 500 stocks are down 20% or more from a 252-day high
- The number of sub-industry groups with a positive 1-year rolling return is less than 20%
- After similar signals, the probabilities favor a 1-4 day bounce within the context of a bear market
- Long-term results look constructive post the 1929-42 secular bear period
How do current market conditions compare to history?
In a note on 5/13/22, I shared a breadth composite containing diverse components based on long-duration calculations. The aim was to assess whether the current level for each series had reached a point that had historically produced an oversold mean-reversion bounce. The analysis suggested the market could bounce over the next 1-4 days, and we got a 4% bounce in 3 days. However, the S&P 500 is now down 4.6% a month later, which is not a surprise given the cloudy outlook on the longer-duration time frames. So, now that the S&P 500 has fallen further and our composite indicators are even more oversold, let's plug in the closing value for our time series from 6/16/22. Once again, the goal is to assess if the current oversold condition provides us with an edge for a mean reversion bounce.
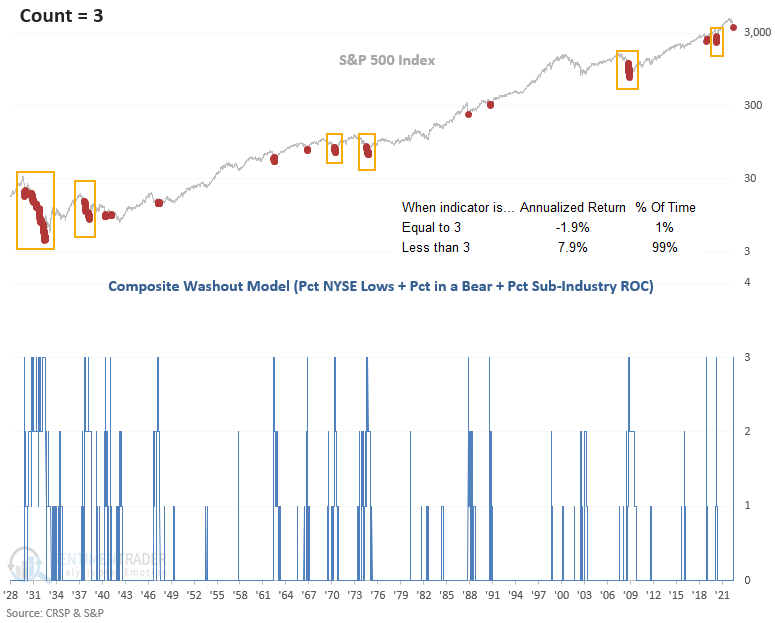
As a reminder, when each indicator value achieves its respective threshold level in a trailing 5-day lookback period, the composite count will increase to 3. The study will buy the S&P 500 when the composite count crosses 2.99.
To be clear, this is not a trading model that I monitor. I'm comparing the closing value of 3 market breadth indicators to assess whether we can find an edge that would suggest the market can bounce from an oversold condition.
When the composite count maintains a level of 3, the S&P 500 annualizes at -1.9%. Sustained readings impact the returns during protracted bear markets like 1929-32, 1937-38,1968-70, 1973-74, and 2007-08.
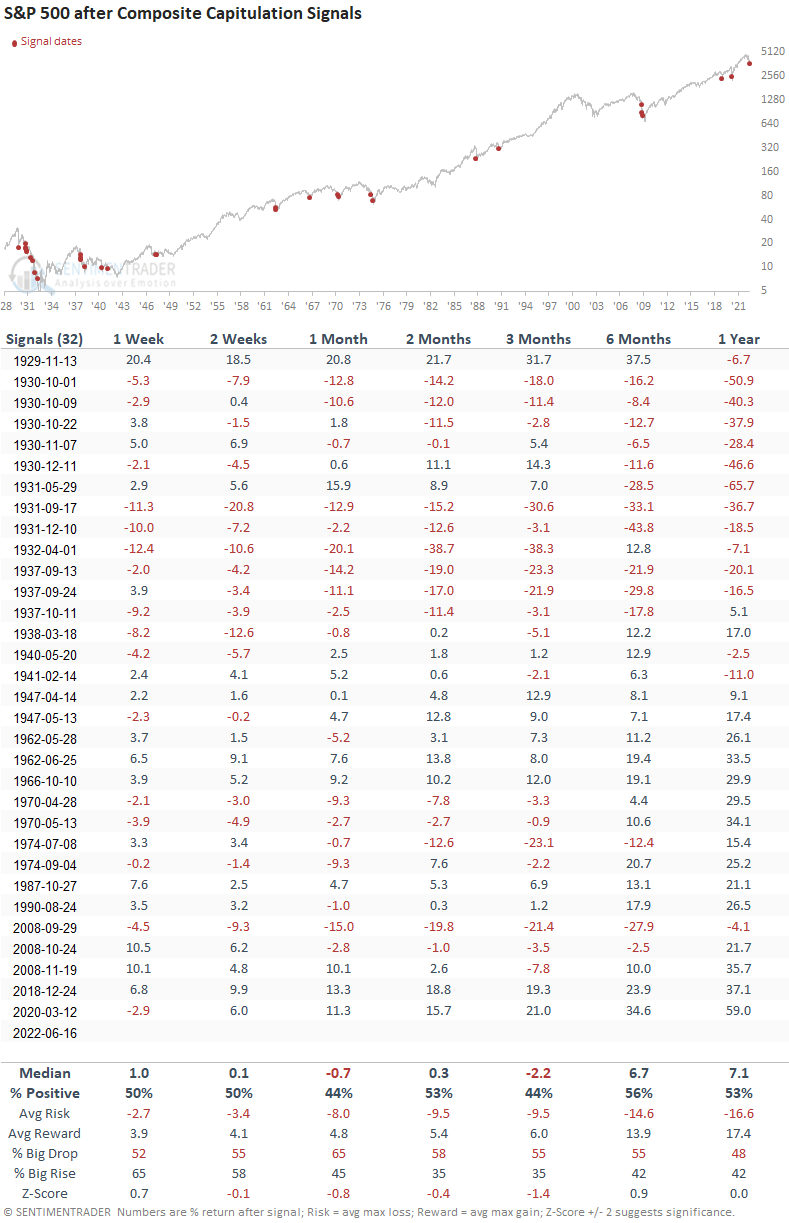
Similar signals preceded a tepid short to medium-term outlook
This study generated a signal 32 other times over the past 93 years. After the others, S&P 500 future returns, win rates, and risk/reward profiles look somewhat tepid in the 1-12-week range and more favorable in longer-duration time frames. The signal shows a positive return at some point in the 6-12-month time frames in 18 out of 19 cases since 1938. As with most historical analyses, the outlook improves after the 1929-42 secular bear market period. Interestingly, the signal on 11/13/1929 marked an intermediate-term low during the 1929-32 bear market.
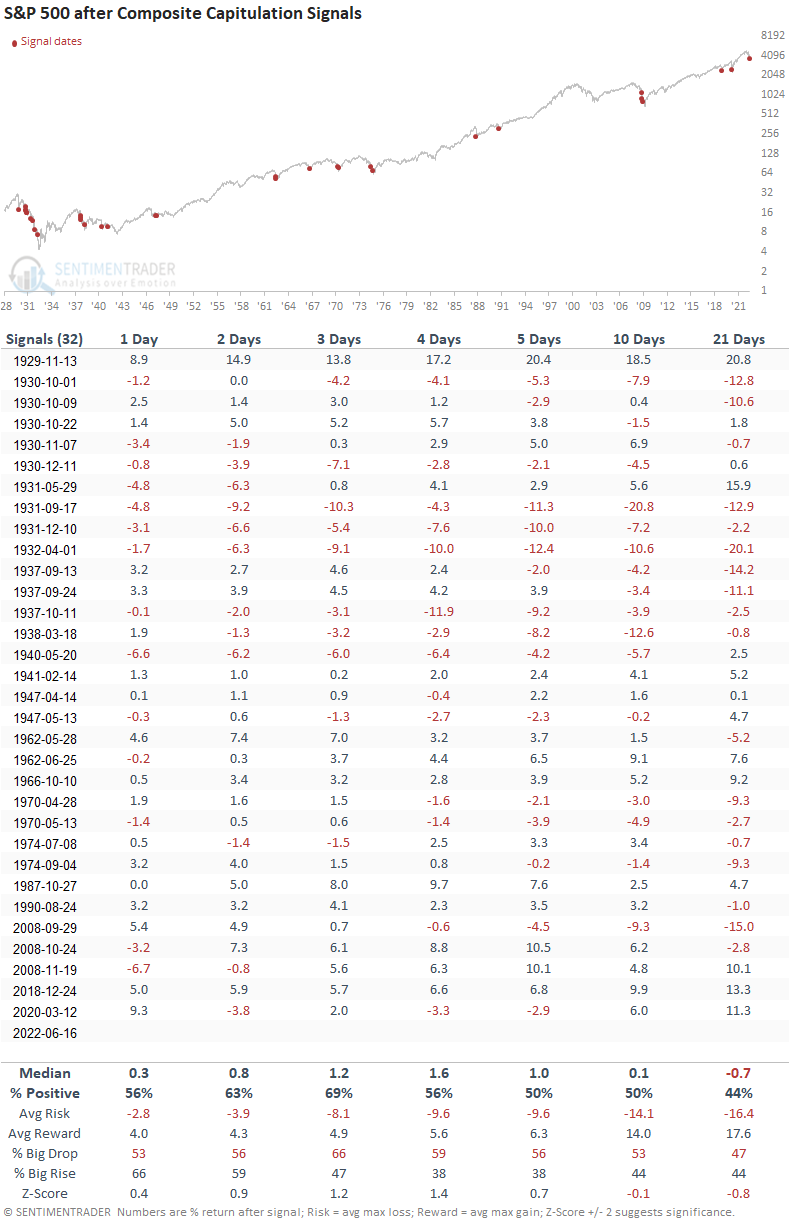
The short-term outlook table suggests a bounce is possible
S&P 500 future returns, win rates, and risk/reward profiles suggest the market could bounce in the next 1 to 4 days.
NYSE Lows remain low relative to other risk-off periods
The percentage of NYSE lows hit 32% on Thursday. That's well below other bear market periods and, in several cases, below levels reached in correction periods like 2011, 2015-16, and 2018. I guess one could view that as a positive. However, 32% is the highest level in the current drawdown. So, that means lows are expanding. Historically, markets bottom when lows are contracting, not growing.
What the research tells us...
When the market breadth composite score increases to 3, history suggests an oversold market, leading to a mean-reversion bounce. Similar setups to what we're seeing now have preceded positive gains in the 1-4 day window. However, we must be aware of the big picture as the medium and long-term results look uninspiring across the entire study period. The 6 and 12-month outlook looks better since 1938. NYSE lows, one of the composite components, remain low relative to other risk-off periods and continue to expand. Markets typically bottom when lows are contracting as an index registers lower lows.