Data &
Technology
Research
Reports
Report Solutions
Reports Library
Actionable
Strategies
Free
Resources
Simple Backtest Calculator
Simple Seasonality Calculator
The Kelly Criterion Calculator
Sentiment Geo Map
Public Research Reports
Free Webinar
Pricing
Company
About
Meet Our Team
In the News
Testimonials
Client Success Stories
Contact
Log inLoginSign up
< BACK TO ALL REPORTS

Short-Term Risk Levels signal a potential opportunity

Jay Kaeppel
2021-12-06
The Short-Term Risk Levels indicator fell to a level of 1 on Friday. Such a low level tended to lead to positive returns over the next 6 months.

Key Points

  • The Short-Term Risk Levels indicator fell to a reading of 1 (suggesting low risk)
  • Stock market returns following previous readings of 1 have generally been favorable
  • This reading is not intended to imply that there is NO risk for stock traders

Short-Term Risk Levels

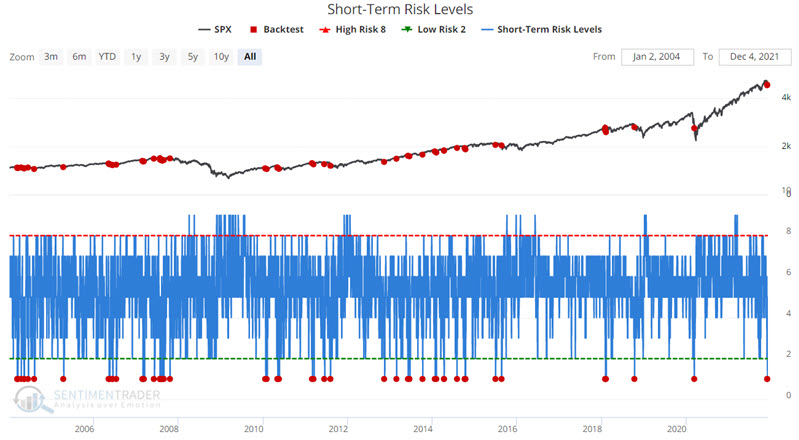
Our Short-Term Risk Level indicator can fluctuate from 0 to 10. In essence, the lower the reading, the less perceived risk in the stock market and vice versa. 

One way to look at it is in terms of cash. If one were to rely solely on this indicator to allocate capital (not recommended), then a Risk Level of 0 would suggest keeping 0% of one's portfolio in cash (i.e., fully invested). A Risk Level of 10 suggests keeping 100% of one's portfolio in cash (i.e., no exposure to stocks).

Using short-term risk for longer-term returns

Even though the Short-Term Risk Level is meant for, well, shorter-term movements, a very low level doesn't happen very often, so let's take a look at longer-term returns. Our test runs from the end of 2003 through last Friday, using the S&P 500 index. The trading methodology is as follows:

  • Each time Short-Term Risk Levels falls from above 1 to a value of 1 or lower, we will buy and hold the S&P 500 Index for six months
  • If a new signal occurs within six months of a previous signal, we will extend the holding period for an additional six months

A holding period can extend indefinitely if new signals continue to occur frequently. You can run this test in the Backtest Engine.

The results show a mostly positive bias

In the chart below, the red dots highlight previous Short-Term Risk Levels readings of 1.

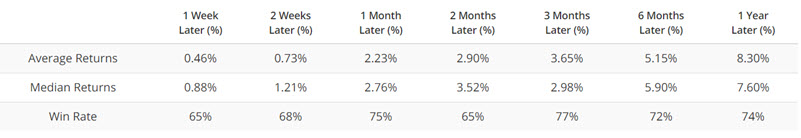
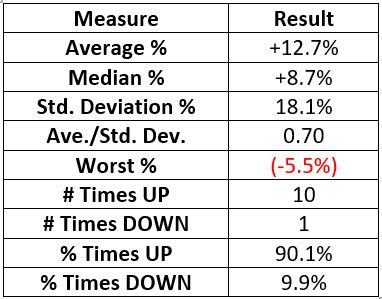
The table below displays a summary of trading performance after all signals (including overlapping signals).

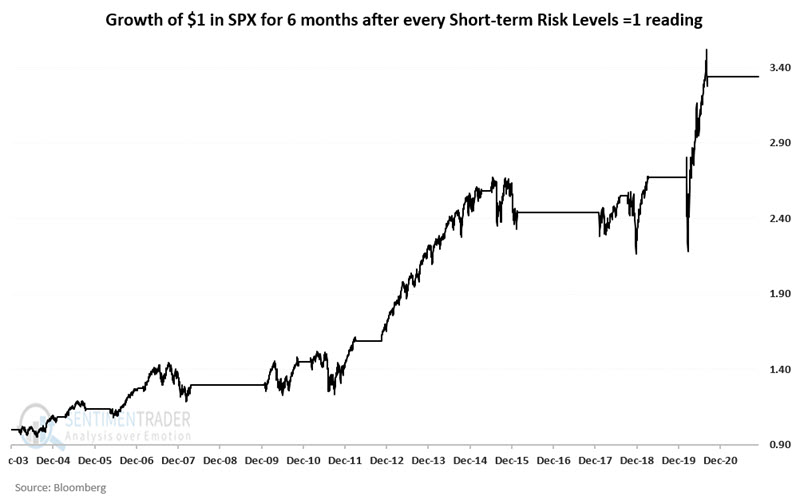
The chart below shows the growth of $1 invested in the S&P 500 Index using the rules described above, with $1 growing to nearly $3.50. There were some drawdowns and periods of inactivity when risk never declined to the threshold level.

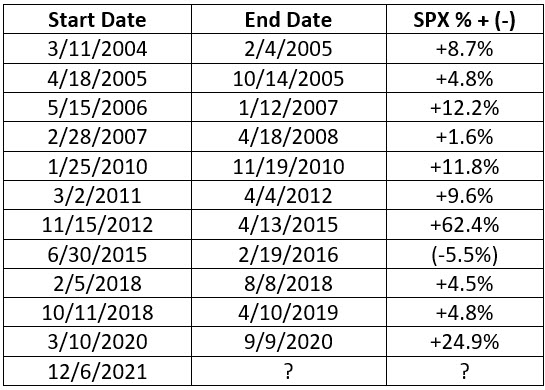
The table below displays the holding periods and S&P returns, including those that extend beyond six months if new signals occur within six months of an original signal.

The summary stats show that 10 out of 11 signals were winners, with an average return of nearly 13%.

What the research tells us…

When the Short-Term Risk Level fell to 1, 10 out of 11 signals showed a positive return over the next 6 months. From a real-world trading perspective, traders need to note in the equity chart above that returns - though positive - are by no means a straight line advance. Interim drawdowns have exceeded -15% on four occasions, with a maximum drawdown of -22.3%, so "low risk" should not be confused with "no risk."

DATA &
TECHnologies
IndicatorEdge
‍
BackTestEdge
‍
Other Tools
‍
DataEdge API
RESEARCH
reports
Research Solution
‍
Reports Library
‍
actionable
Strategies
Trading Strategies
‍
Smart Stock Scanner
‍
FREE
RESOUrCES
Simple Backtest
Calculator
Simple Seasonality
Calculator
The Kelly Criterion
Calculator
Sentiment Geo Map
‍
Public Research Reports
‍
Free Webinar
COMPANY
‍
About
‍
Meet our Team
‍
In the News
‍
Testimonials
‍
Client Success Stories
Pricing
Bundle pricing
‍
Announcements
‍
FAQ
© 2024 Sundial Capital Research Inc. All rights reserved.
Setsail Marketing
TermsPrivacyAffiliate Program
Risk Disclosure: Futures and forex trading contains substantial risk and is not for every investor. An investor could potentially lose all or more than the initial investment. Risk capital is money that can be lost without jeopardizing ones’ financial security or life style. Only risk capital should be used for trading and only those with sufficient risk capital should consider trading. Past performance is not necessarily indicative of future results.

Hypothetical Performance Disclosure: Hypothetical performance results have many inherent limitations, some of which are described below. No representation is being made that any account will or is likely to achieve profits or losses similar to those shown; in fact, there are frequently sharp differences between hypothetical performance results and the actual results subsequently achieved by any particular trading program. One of the limitations of hypothetical performance results is that they are generally prepared with the benefit of hindsight. In addition, hypothetical trading does not involve financial risk, and no hypothetical trading record can completely account for the impact of financial risk of actual trading. for example, the ability to withstand losses or to adhere to a particular trading program in spite of trading losses are material points which can also adversely affect actual trading results. There are numerous other factors related to the markets in general or to the implementation of any specific trading program which cannot be fully accounted for in the preparation of hypothetical performance results and all which can adversely affect trading results.

Testimonial Disclosure: Testimonials appearing on this website may not be representative of other clients or customers and is not a guarantee of future performance or success.