Data &
Technology
Research
Reports
Report Solutions
Reports Library
Actionable
Strategies
Free
Resources
Simple Backtest Calculator
Simple Seasonality Calculator
The Kelly Criterion Calculator
Sentiment Geo Map
Public Research Reports
Free Webinar
Pricing
Company
About
Meet Our Team
In the News
Testimonials
Client Success Stories
Contact
Log inLoginSign up
< BACK TO ALL REPORTS

Short bets fall to 6-year low

Jason Goepfert
2020-09-01
Shares sold short against NYSE securities fell to a 6-year low during mid-August. That's more than 10% below the long-term trend in short interest. Stocks have shown below-average returns when short interest was low, especially this low.

As stocks have enjoyed a relentless rally, those who sell stocks short hoping to buy them back later at a lower price have fled.

According to Business Insider, investors haven't been this bullish on the stock market in at least 15 years.

"In a note published on Thursday, Goldman Sachs highlighted that short interest in the S&P 500 has fallen to its lowest level in at least 15 years of its 16-year data history. The decline in short interest comes as stocks cruise to record highs after recovering from the fastest bear market on record...The median stock within the S&P 500 had outstanding short interest equating to just 1.8% of its market cap, Goldman said."

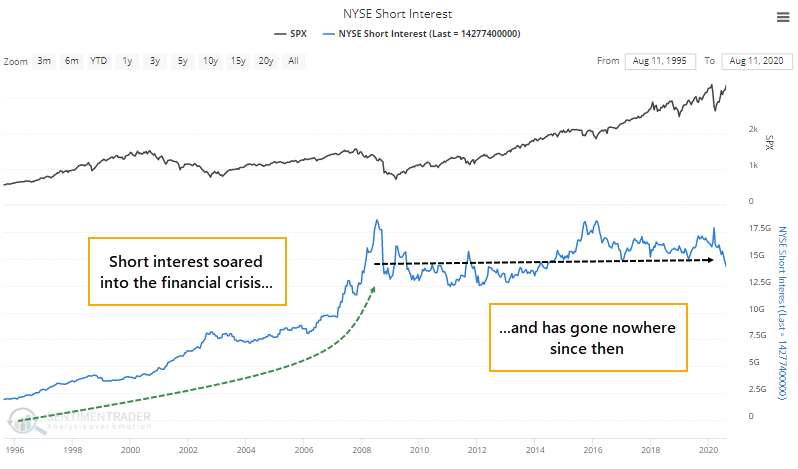
As a result, short interest among all NYSE securities has plunged. Short interest reflects the number of shares currently held short, needing to be bought back at a later date. After many years of rising short interest leading into the financial crisis, overall short interest levels have held relatively steady during the past decade.

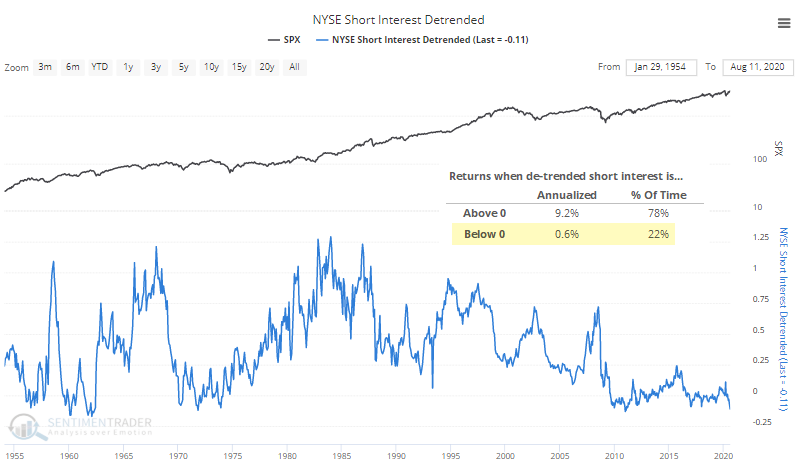
Because short interest can be "trendy" over time, we de-trend it. This is simply each month's figure divided by its average over the past 5 years. We can see below how it has plunged from being 10% above average in March to more than 10% below average in August.

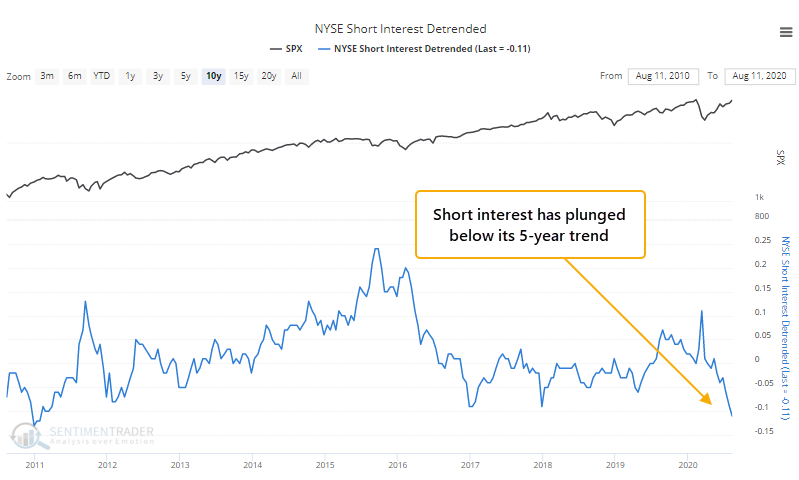
A longer-term view shows that this is unusually low. The S&P 500's annualized return when short interest is above trend is +9.2%. When short interest is below trend, that falls to +0.6%.

When short interest falls more than 10% below average, forward returns in the S&P were subpar over the next 9-12 months. Two years later, all of the signals showed a positive return.

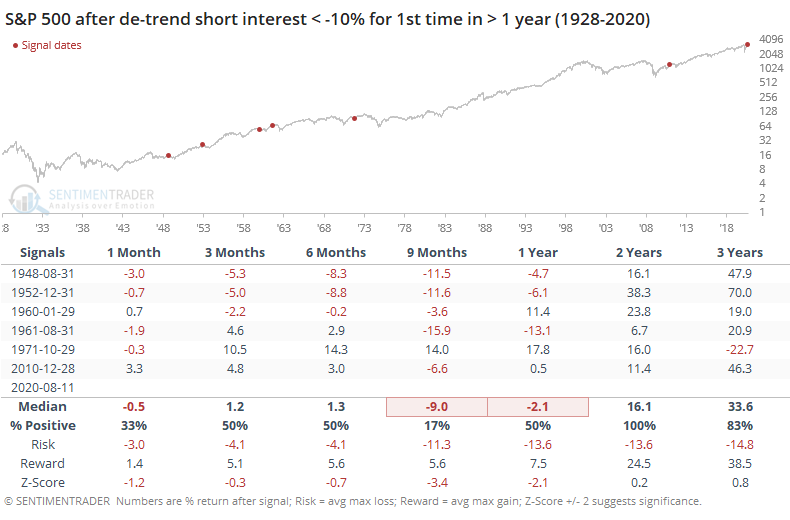
Over the next 9 months, there was only a single winner out of 6 signals. That's too small of a sample size, with too big of an outlier, to be confident that this is a solid downside edge. We don't put a lot of weight on short interest anyway, so this would be at most a mild warning that some potential buying demand has been depleted.

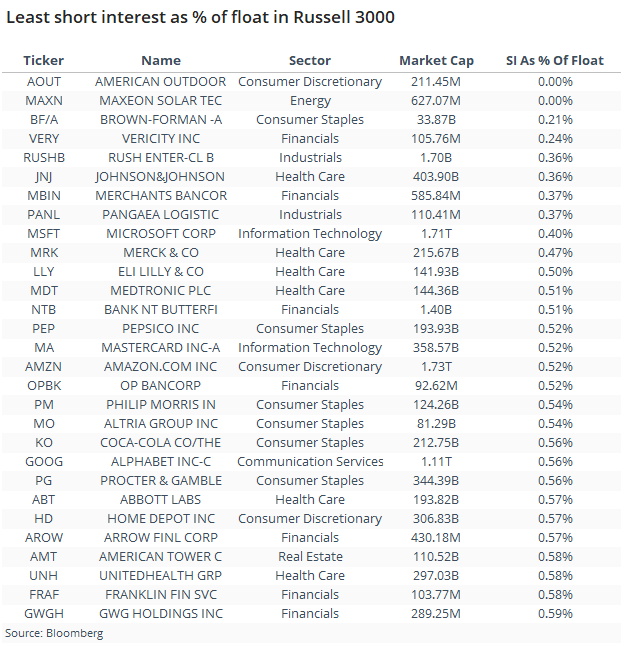
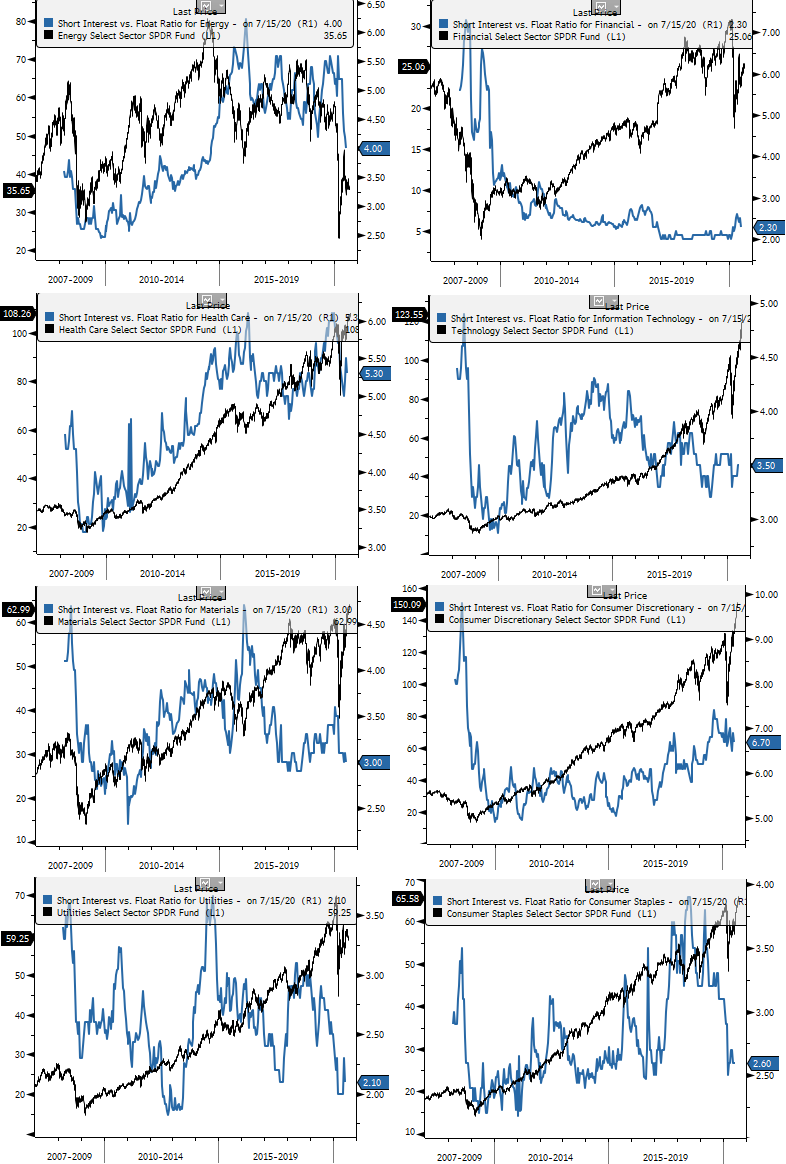
Among major sectors, only energy and health care are seeing short interest as percentage of float on the upper ends of their ranges, according to Bloomberg calculations. Most of the others near the low ends of their ranges, particularly materials, staples, and utilities.

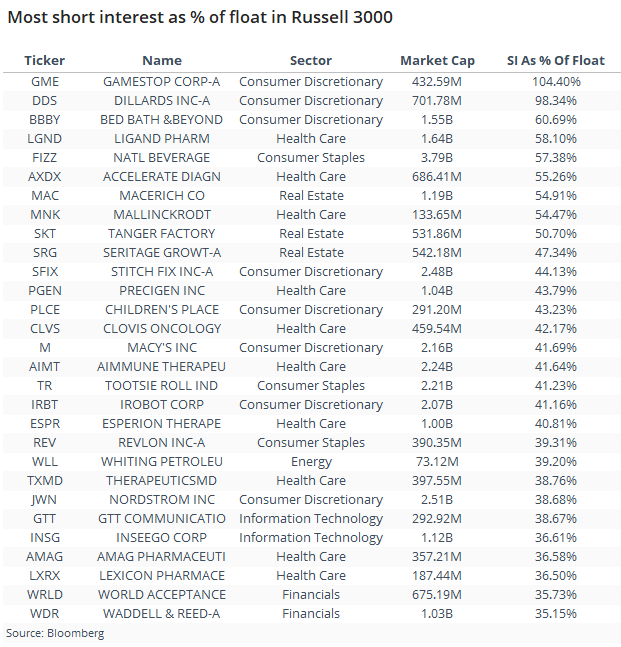
Within the Russell 3000, the tables below show the stocks with the least and most short interest outstanding as a percentage of float.

Sorry, you don't have access to this report

Upgrade your subscription plan to get access
Go to Dasboard
DATA &
TECHnologies
IndicatorEdge
‍
BackTestEdge
‍
Other Tools
‍
DataEdge API
RESEARCH
reports
Research Solution
‍
Reports Library
‍
actionable
Strategies
Trading Strategies
‍
Smart Stock Scanner
‍
FREE
RESOUrCES
Simple Backtest
Calculator
Simple Seasonality
Calculator
The Kelly Criterion
Calculator
Sentiment Geo Map
‍
Public Research Reports
‍
Free Webinar
COMPANY
‍
About
‍
Meet our Team
‍
In the News
‍
Testimonials
‍
Client Success Stories
Pricing
Bundle pricing
‍
Announcements
‍
FAQ
© 2024 Sundial Capital Research Inc. All rights reserved.
Setsail Marketing
TermsPrivacyAffiliate Program
Risk Disclosure: Futures and forex trading contains substantial risk and is not for every investor. An investor could potentially lose all or more than the initial investment. Risk capital is money that can be lost without jeopardizing ones’ financial security or life style. Only risk capital should be used for trading and only those with sufficient risk capital should consider trading. Past performance is not necessarily indicative of future results.

Hypothetical Performance Disclosure: Hypothetical performance results have many inherent limitations, some of which are described below. No representation is being made that any account will or is likely to achieve profits or losses similar to those shown; in fact, there are frequently sharp differences between hypothetical performance results and the actual results subsequently achieved by any particular trading program. One of the limitations of hypothetical performance results is that they are generally prepared with the benefit of hindsight. In addition, hypothetical trading does not involve financial risk, and no hypothetical trading record can completely account for the impact of financial risk of actual trading. for example, the ability to withstand losses or to adhere to a particular trading program in spite of trading losses are material points which can also adversely affect actual trading results. There are numerous other factors related to the markets in general or to the implementation of any specific trading program which cannot be fully accounted for in the preparation of hypothetical performance results and all which can adversely affect trading results.

Testimonial Disclosure: Testimonials appearing on this website may not be representative of other clients or customers and is not a guarantee of future performance or success.