
Short and long-term prospects for treasury bonds

Key points
- Treasury bonds have been in a bear market since peaking during the Covid panic of March 2020
- With interest rates appearing to be in a longer-term rising trend, long-term prospects for bonds remain murky
- On a shorter-term basis, a decent trading opportunity may be in the offing
First, the bigger picture for interest rates
Historical data suggests that interest rates tend to move in very long cycles - often 30 years in one direction at a time. In the past 120 years, a 120-month exponential moving average has mostly kept investors on the right side of the trend. The chart below displays the yield on 10-year treasury notes with the 120-month EMA plotted in blue. Note the long-term nature of the waves and how well the EMA captures the bulk of long-term rising and falling trends.
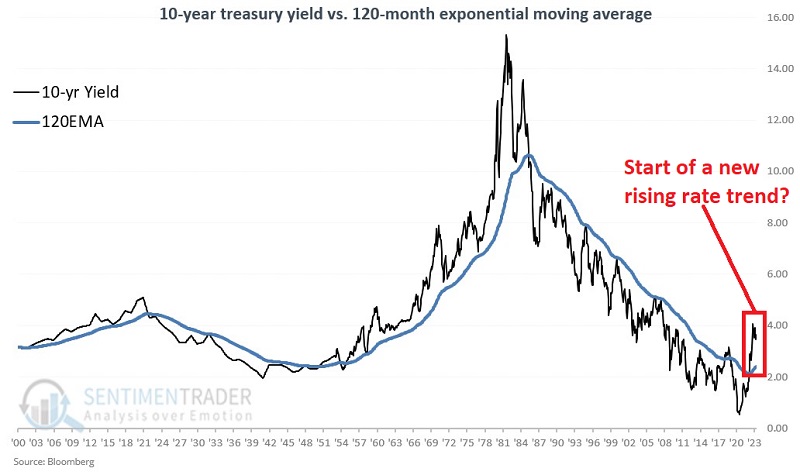
While nothing is guaranteed, yield action in recent years suggests that we may be in the early stages of a long-term wave of higher interest rates.
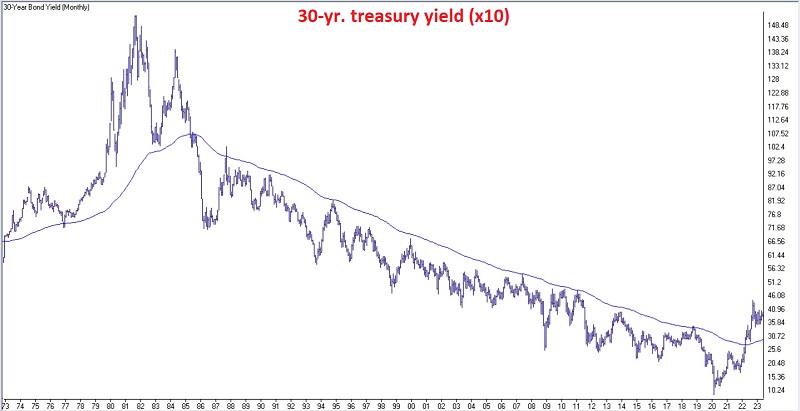
30-year treasuries have a shorter history, but results are pretty similar. The chart below (courtesy of AIQ TradingExpert) displays the yield on 10-year treasury notes with the 120-month EMA plotted in blue. Here too, we see that yields are now back above their long-term moving average, indicating an overall rising rate environment.
Other factors weighing on bonds
The copper/gold ratio has a long history of being somewhat inversely correlated to interest rates. A lower and/or declining ratio suggests higher rates (i.e., lower bond prices) and vice versa. The chart below highlights when the Copper/Gold Ratio was below 0.20.
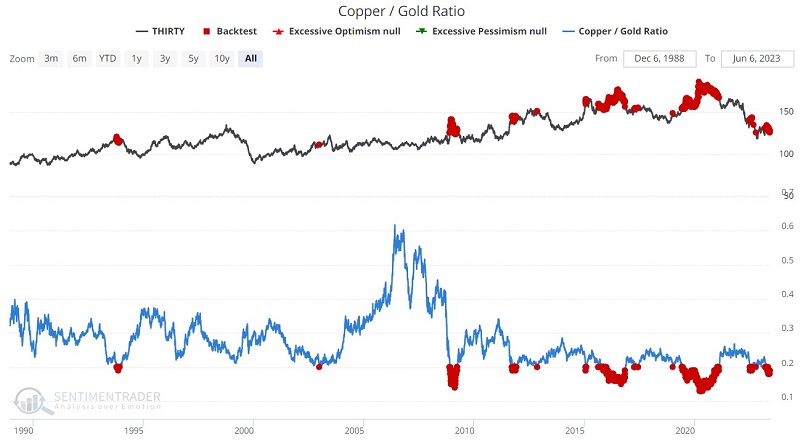
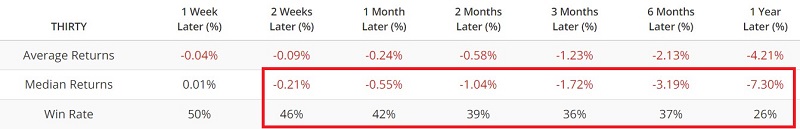
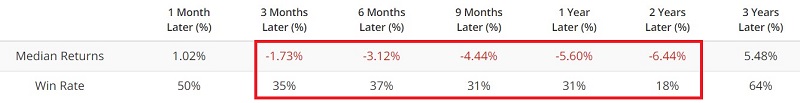
The table below summarizes the performance for 30-year treasury futures following the signals in the chart above. Overall, results have tended to skew unfavorably for bond prices.
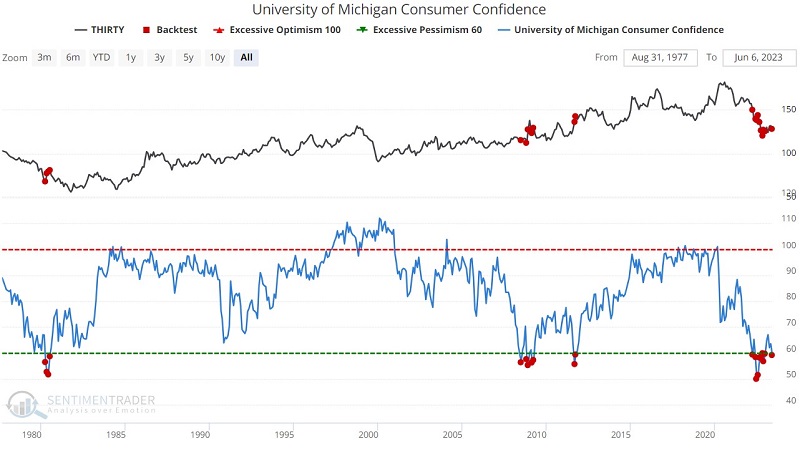
Another measure that can impact the bond market is consumer confidence. The chart and table below highlight those times when the University of Michigan Consumer Confidence indicator was below 60 as it is now.
All of the information so far argues against a long-term commitment to treasury bonds, particularly 20+ year treasuries, which are the most sensitive to interest rate fluctuations. Still, even the worst bear market typically experiences significant countertrend moves. Evidence exists that a possible opportunity for shorter-term bond traders may be in the offing.
The favorable case for bond traders
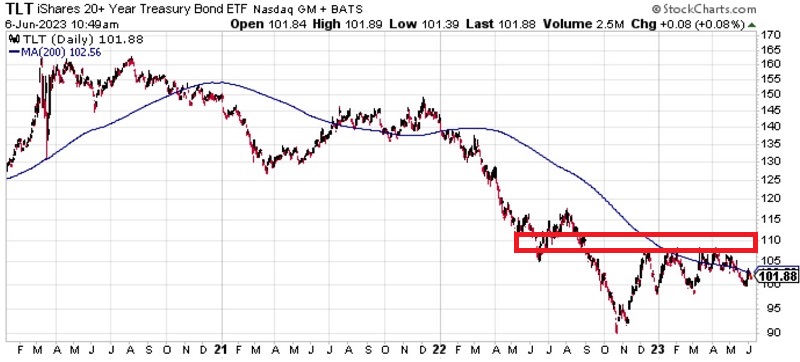
The iShares 20+ Year Treasury Bond ETF (TLT) declined -49% from March 2020 to the October 2022 low. Since then TLT has rallied roughly 11% but arguably remains mired in a downtrend below its 200-day moving average. In the chart below (courtesy of StockCharts), TLT still faces resistance at the 200-day average of around $104 and further price resistance between $108 and $110.
Still, there are several reasons for shorter-term, countertrend traders to watch treasury bonds closely.
Seasonality may be a tailwind
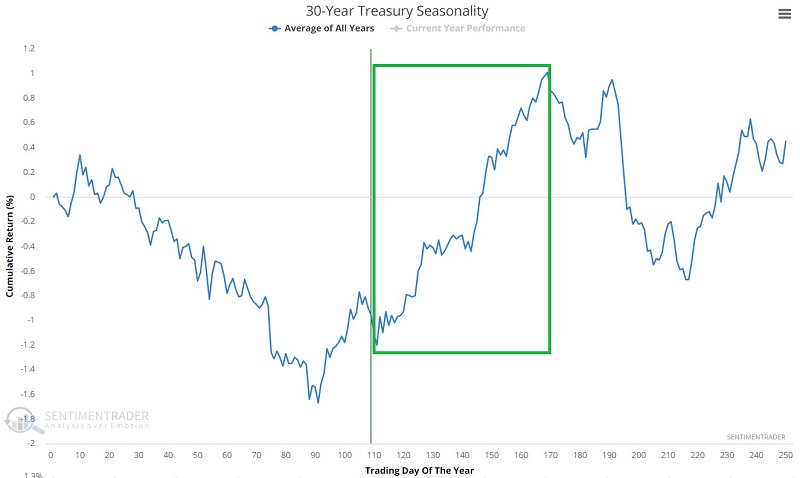
The chart below displays the annual seasonal trend for 30-year treasury bond futures. Note the favorable seasonal period that extends from Trading Day of Year (TDY) #111 through TDY #168. For 2023 that period extends from the close on 2023-06-06 through 2023-08-24.
The chart and table below highlight 30-year treasury bond futures performance during this seasonal window since 1978.
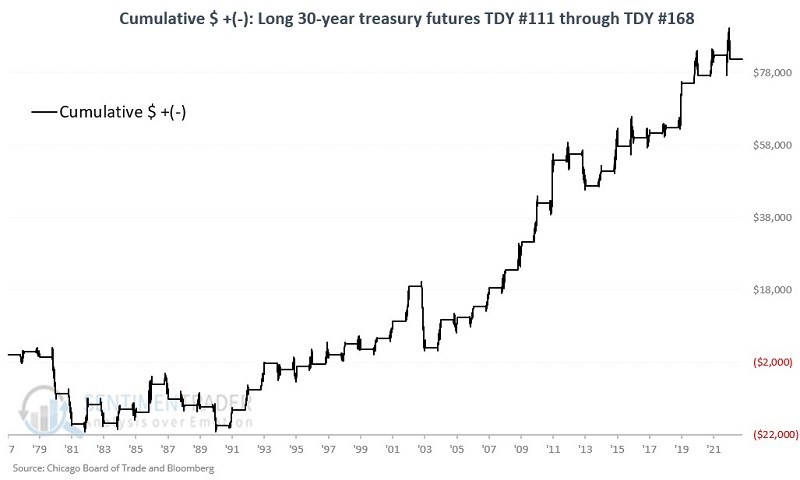
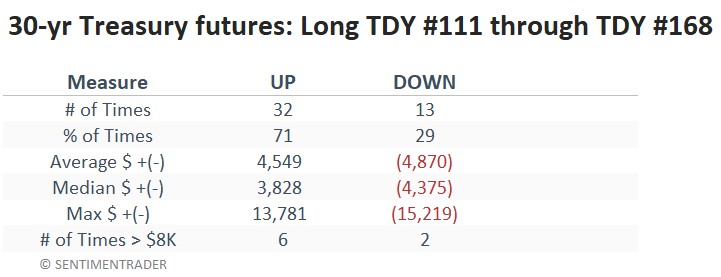
Clearly, this seasonal window is no "sure thing." What it does tell us is that if treasuries are finally going to stage a decent rally, this would be a likely time for that to happen.
Trader sentiment is flashing several favorable signals
Bond prices often bounce after trader sentiment plunges to a washed-out level and then reverses. The chart and table below highlight TLT performance after the 10-day average for 10-Year Optix crossed above 7.5.
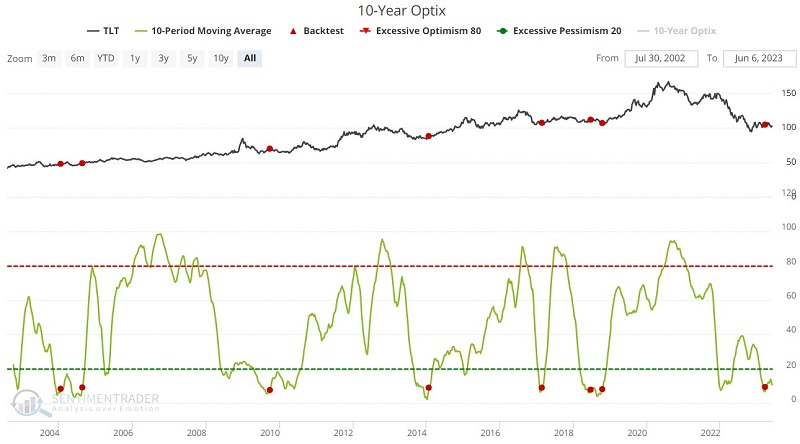
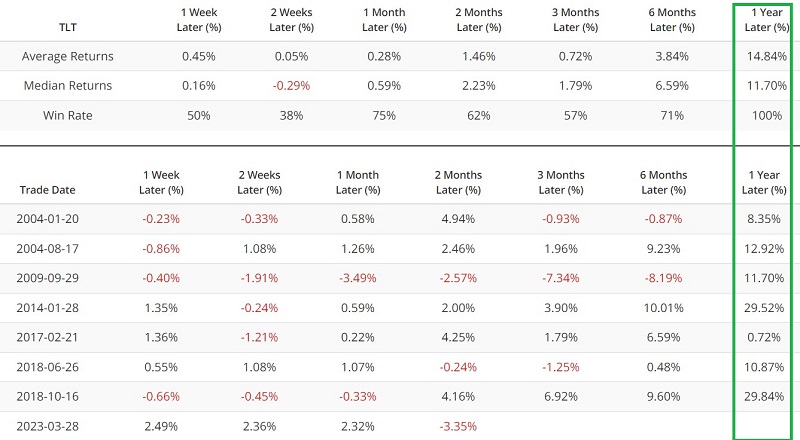
The most recent signal on 2023-03-28 has seen TLT decline slightly over 2% so far. Still, when paired with a more favorable seasonal period, there is reason for hope among bullish bond traders.
Options traders also flashing a potentially favorable signal
Our TLT Open Interest Ratio indicator shows the number of outstanding put options divided by the number of outstanding call options. When traders have been holding many more puts relative to calls, TLT has tended to struggle going forward. When there were few puts relative to calls, TLT tended to rise.
The chart and table below highlight TLT performance when the 5-day average for this indicator fell below 0.5.
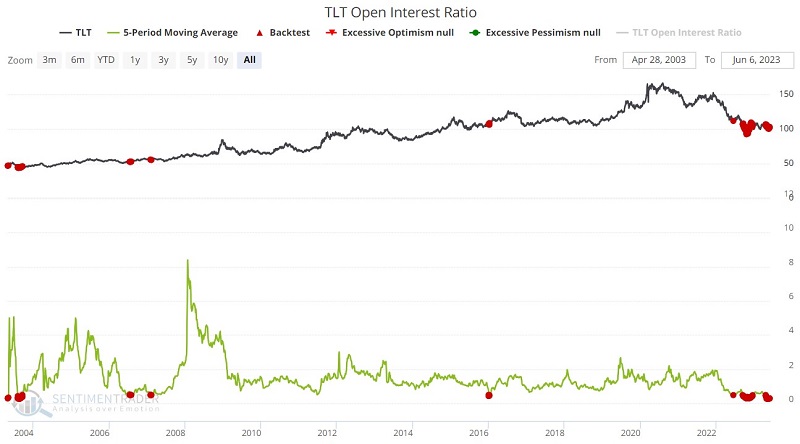
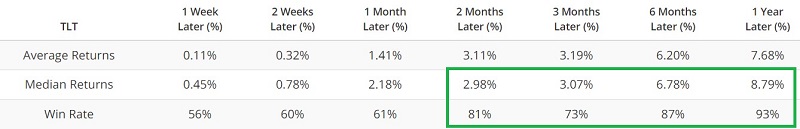
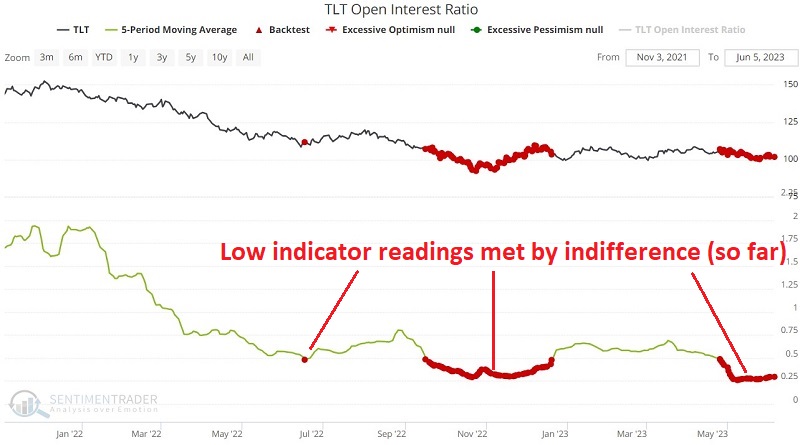
Historical results have been favorable. However, as you can see in the zoomed-in chart below, several clusters of signals in the past seven months have been met by still persistent sideways to lower price action. These signals are entering "now or never" territory.
What the research tells us…
Based on the very long-term nature of interest rate movements, it is easy to be pessimistic regarding the multi-year outlook for treasury bonds. Nevertheless, enough evidence (Seasonality, bond trader sentiment, options trader sentiment, and price action that has not seen a new low since October 2022) is piling up on the favorable side of the ledger to alert shorter-term traders of a potential bullish opportunity. The most straightforward approach is to trade treasury bond futures. Non-futures traders can focus on shares of TLT or options on TLT.
Additional risk considerations for traders looking to play the long side of treasury bonds: Countertrend trading carries its own unique risk and there is little - if any - bullish confirmation in price action to date. Nevertheless, the primary point is that now is the time for shorter-term bond traders to be paying close attention, and watching for signs of bullish confirmation.