Data &
Technology
Research
Reports
Report Solutions
Reports Library
Actionable
Strategies
Free
Resources
Simple Backtest Calculator
Simple Seasonality Calculator
The Kelly Criterion Calculator
Sentiment Geo Map
Public Research Reports
Free Webinar
Pricing
Company
About
Meet Our Team
In the News
Testimonials
Client Success Stories
Contact
Log inLoginSign up
< BACK TO ALL REPORTS

Shocks' Strong Tendency To Recover

Jason Goepfert
2019-08-07
null

Shocking^3

We’ve looked at “shock days” quite a bit over the years, most recently in May. Monday’s session exceeded the one in May, with a move more than 3 deviations beyond what investors have become accustomed to over the past year.

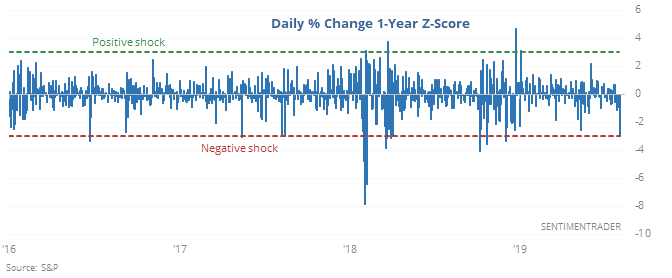
Swift, sharp declines like this almost never end up morphing into more extreme declines. Over the next 2-3 months, losses were rare. There was only one loss of any significance over that time frame, in February 1994, and even that loss was subsequently erased in the month(s) ahead.

Hanging by a thread

Barely a week after indexes like the S&P 500 were sitting at all-time highs, more than 9% of issues traded on the NYSE fell to their lowest prices in at least a year. This is the kind of warning that has been triggering for weeks on the Nasdaq but is even more egregious when it’s on the NYSE.

This has been ominous, especially in the short-term. Only two of them managed to gain over the next two weeks, and most of those small gains were then given back in the subsequent week(s). How can we reconcile these two developments, which seemingly contradict each other? Maybe there isn’t a way, though the jump in new lows has been more negative in the shorter-term, while the “shock day” has been more positive in the medium- to longer-term. And maybe it’s just that simple.

Bond bulls

The Optimism Index for bonds has jumped above 70 as investors move into the “safety” of that market.

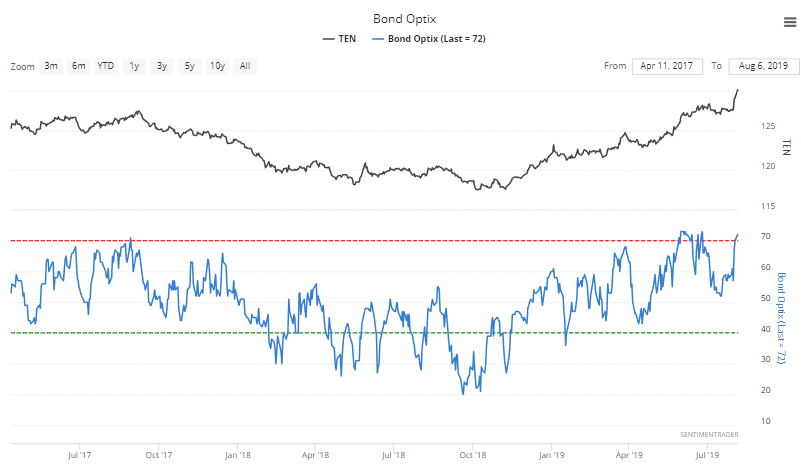
According to the Backtest Engine, a reading above 70 led to an average (price only) return in 10-year Treasury note futures of -1.5% over the next six months.

Since the inception of the TLT fund, its average 6-month return was a lousy -2.2% (compared to +7.3% when the Optix was below 30).

Zero-bound

According to the Heatmap, the most-hated fund of all we follow was focused on Indian stocks (INDA), with an Optimism Index below 2, about as low as it goes. The Backtest Engine shows that INDA rebounded after all 10 other times it dropped this low over the next 2 weeks, averaging 8.3%.

This post was an abridged version of our previous day's Daily Report. For full access, sign up for a 30-day free trial now.

DATA &
TECHnologies
IndicatorEdge
‍
BackTestEdge
‍
Other Tools
‍
DataEdge API
RESEARCH
reports
Research Solution
‍
Reports Library
‍
actionable
Strategies
Trading Strategies
‍
Smart Stock Scanner
‍
FREE
RESOUrCES
Simple Backtest
Calculator
Simple Seasonality
Calculator
The Kelly Criterion
Calculator
Sentiment Geo Map
‍
Public Research Reports
‍
Free Webinar
COMPANY
‍
About
‍
Meet our Team
‍
In the News
‍
Testimonials
‍
Client Success Stories
Pricing
Bundle pricing
‍
Announcements
‍
FAQ
© 2024 Sundial Capital Research Inc. All rights reserved.
Setsail Marketing
TermsPrivacyAffiliate Program
Risk Disclosure: Futures and forex trading contains substantial risk and is not for every investor. An investor could potentially lose all or more than the initial investment. Risk capital is money that can be lost without jeopardizing ones’ financial security or life style. Only risk capital should be used for trading and only those with sufficient risk capital should consider trading. Past performance is not necessarily indicative of future results.

Hypothetical Performance Disclosure: Hypothetical performance results have many inherent limitations, some of which are described below. No representation is being made that any account will or is likely to achieve profits or losses similar to those shown; in fact, there are frequently sharp differences between hypothetical performance results and the actual results subsequently achieved by any particular trading program. One of the limitations of hypothetical performance results is that they are generally prepared with the benefit of hindsight. In addition, hypothetical trading does not involve financial risk, and no hypothetical trading record can completely account for the impact of financial risk of actual trading. for example, the ability to withstand losses or to adhere to a particular trading program in spite of trading losses are material points which can also adversely affect actual trading results. There are numerous other factors related to the markets in general or to the implementation of any specific trading program which cannot be fully accounted for in the preparation of hypothetical performance results and all which can adversely affect trading results.

Testimonial Disclosure: Testimonials appearing on this website may not be representative of other clients or customers and is not a guarantee of future performance or success.