Data &
Technology
Research
Reports
Report Solutions
Reports Library
Actionable
Strategies
Free
Resources
Simple Backtest Calculator
Simple Seasonality Calculator
The Kelly Criterion Calculator
Sentiment Geo Map
Public Research Reports
Free Webinar
Pricing
Company
About
Meet Our Team
In the News
Testimonials
Client Success Stories
Contact
Log inLoginSign up
< BACK TO ALL REPORTS

Shanghai Breadth Nears Record For Selling Persistence

Jason Goepfert
2016-01-28
null

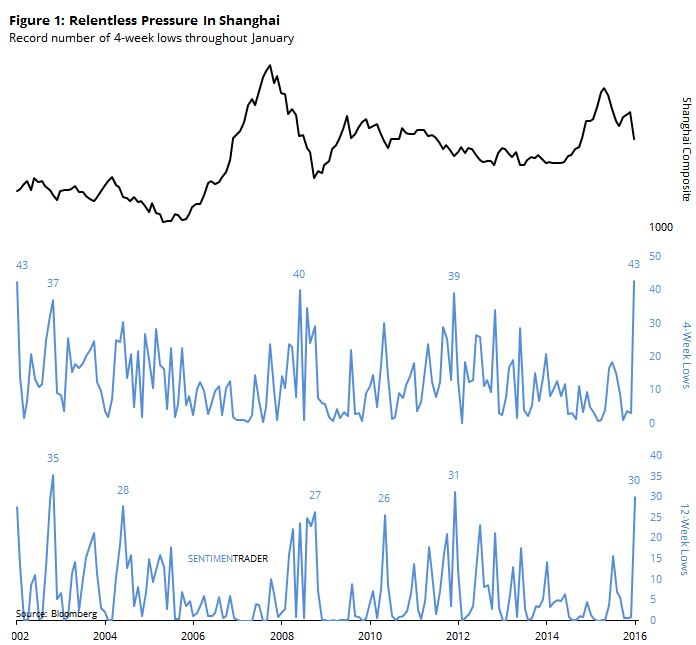
The selling pressure in Chinese shares has been relentless in January and shows no signs of letting up as the Shanghai Composite dives to yet another yearly low.

There is not a consistent relationship between that index and U.S. stocks. It's a fascination among many market-watchers but share performance in China has been a poor predictor for share performance in other markets.

Breadth figures for stocks in the Shanghai are starting to reach "puke" levels according to several measures. One holdout is the percentage of stocks in the index that are sitting at 52-week lows. It reached 29% on Wednesday while prior peaks in that measure were north of 50% - 60%.

But if we look at the shorter-term persistence of the selling pressure, this month stands out.

On an average day this month, 43% of stocks in the Shanghai closed at a 4-week low. That's tied for a record for any month since 2002, the furthest we can go back. January 2002 had a similar stretch.

Also on an average day this month, 30% of the stocks closed at a 12-week low. That's the third-highest of any month since 2002.

20160128_shanghai

Looking at both figures combined, there were only two months that approached our current level of persistent 4-week and 12-week lows, November 2002 and December 2011.

After November 2002, the Shanghai lost another -5% in December, but was 5% higher three months later and 10% higher six months later.

After December 2011, the Shanghai gained 4% the next month but that was about it as the gains petered out in the months ahead.

The relentless nature of this decline has reached climactic levels, at least on a shorter-term basis, but is not yet to a level that would suggest a long-term disgust like occurred at prior long-term lows.

Sorry, you don't have access to this report

Upgrade your subscription plan to get access
Go to Dasboard
DATA &
TECHnologies
IndicatorEdge
‍
BackTestEdge
‍
Other Tools
‍
DataEdge API
RESEARCH
reports
Research Solution
‍
Reports Library
‍
actionable
Strategies
Trading Strategies
‍
Smart Stock Scanner
‍
FREE
RESOUrCES
Simple Backtest
Calculator
Simple Seasonality
Calculator
The Kelly Criterion
Calculator
Sentiment Geo Map
‍
Public Research Reports
‍
Free Webinar
COMPANY
‍
About
‍
Meet our Team
‍
In the News
‍
Testimonials
‍
Client Success Stories
Pricing
Bundle pricing
‍
Announcements
‍
FAQ
© 2024 Sundial Capital Research Inc. All rights reserved.
Setsail Marketing
TermsPrivacyAffiliate Program
Risk Disclosure: Futures and forex trading contains substantial risk and is not for every investor. An investor could potentially lose all or more than the initial investment. Risk capital is money that can be lost without jeopardizing ones’ financial security or life style. Only risk capital should be used for trading and only those with sufficient risk capital should consider trading. Past performance is not necessarily indicative of future results.

Hypothetical Performance Disclosure: Hypothetical performance results have many inherent limitations, some of which are described below. No representation is being made that any account will or is likely to achieve profits or losses similar to those shown; in fact, there are frequently sharp differences between hypothetical performance results and the actual results subsequently achieved by any particular trading program. One of the limitations of hypothetical performance results is that they are generally prepared with the benefit of hindsight. In addition, hypothetical trading does not involve financial risk, and no hypothetical trading record can completely account for the impact of financial risk of actual trading. for example, the ability to withstand losses or to adhere to a particular trading program in spite of trading losses are material points which can also adversely affect actual trading results. There are numerous other factors related to the markets in general or to the implementation of any specific trading program which cannot be fully accounted for in the preparation of hypothetical performance results and all which can adversely affect trading results.

Testimonial Disclosure: Testimonials appearing on this website may not be representative of other clients or customers and is not a guarantee of future performance or success.