
Several sentiment indicators triggered a buy signal for the Nasdaq 100

Key points:
- Several sentiment-based indicators for the Nasdaq 100 generated buy signals
- Similar precedents in an uptrend suggest the popular index will resume its upward trajectory
- A volatility range rank signal was triggered for Apple, suggesting a bullish outlook
Sentiment-based indicators for the Nasdaq 100 suggest fear is subsiding
Over the last month, sentiment-based indicators for the Nasdaq 100 have signaled heightened levels of uncertainty among investors, potentially reflecting concerns about factors such as inflation, interest rates, and geopolitical tensions.
Last week, the fear subsided, shifting these indicators lower following a reset in the upper end of their recent ranges. This reversal has triggered a flurry of buy alerts from trading models based on the volatility index, liquidity premium, and aggregated put/call ratio.
The previous signals occurred following the July-October correction in 2023, which led to substantial gains for the Nasdaq 100 ETF (QQQ).
A sentiment gauge based on volatility
The CBOE calculates a volatility index for the S&P 500 and several other indexes like the Nasdaq 100. Commonly known as the VIX or the fear gauge, it measures market expectations of near-term volatility conveyed by index option prices. It tends to rise when investors are uncertain or fearful about a market's direction. Conversely, when apprehension subsides, volatility reverts lower.
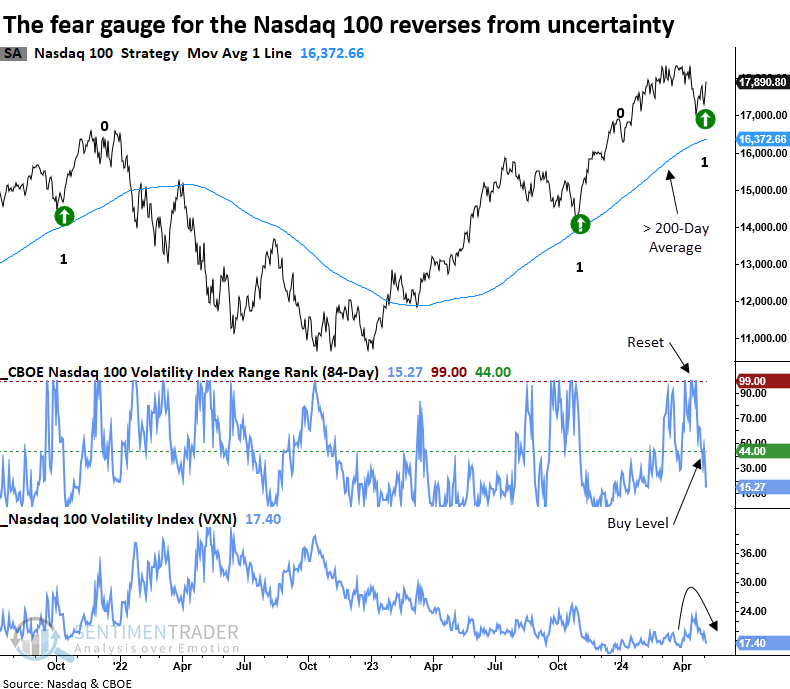
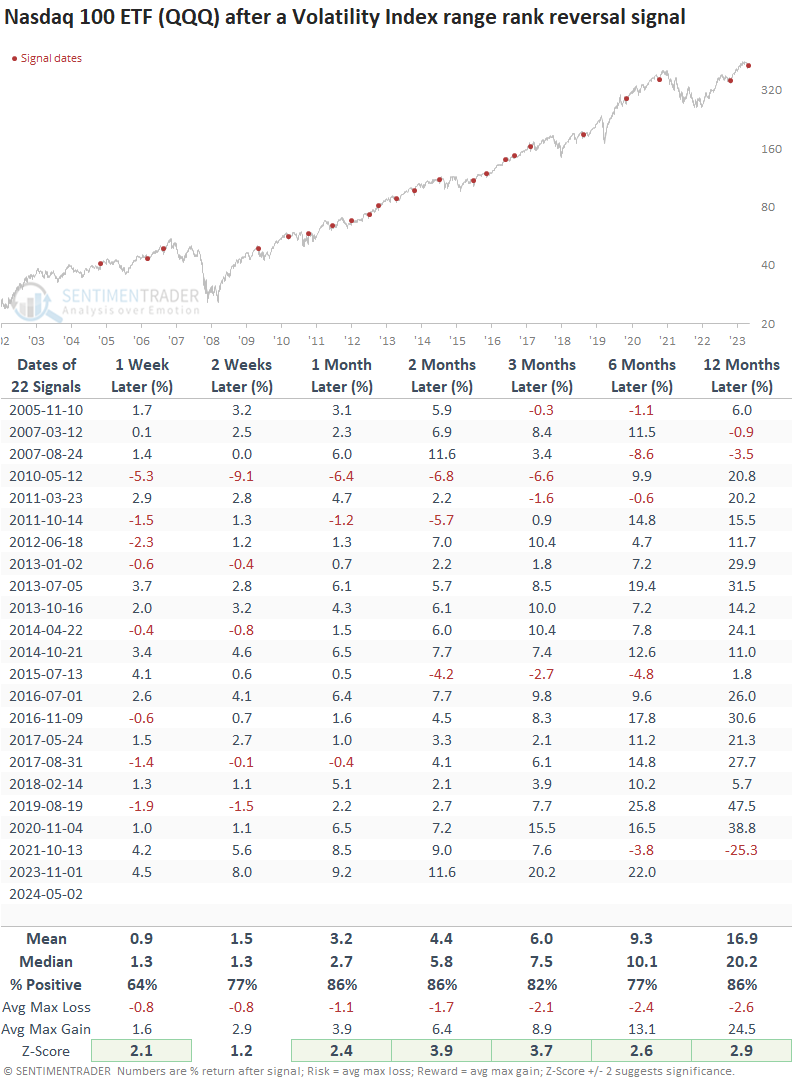
Similar volatility-based sentiment reversals preceded a bullish outlook
Whenever the Nasdaq 100 Volatility Index (VXN) 's 84-day range rank cycled from greater than 99% to less than 44%, with the index above its 200-day average and exhibiting positive momentum, the popular ETF (QQQ) rallied with remarkable consistency.
Over the following month, the QQQ ETF was higher at some point in all but one case. Additionally, over that same time frame, it only suffered one maximum loss exceeding -3.4%.
A sentiment gauge based on trading volume
The liquidity premium compares the volume of the QQQ ETF to the volume of the underlying stocks comprising the Nasdaq 100. When volume in the ETF increases relative to stocks, investors are uncertain about the outlook for the market, a scenario typically associated with corrective phases. Eventually, the doubt subsides, and the indicator reverses direction.
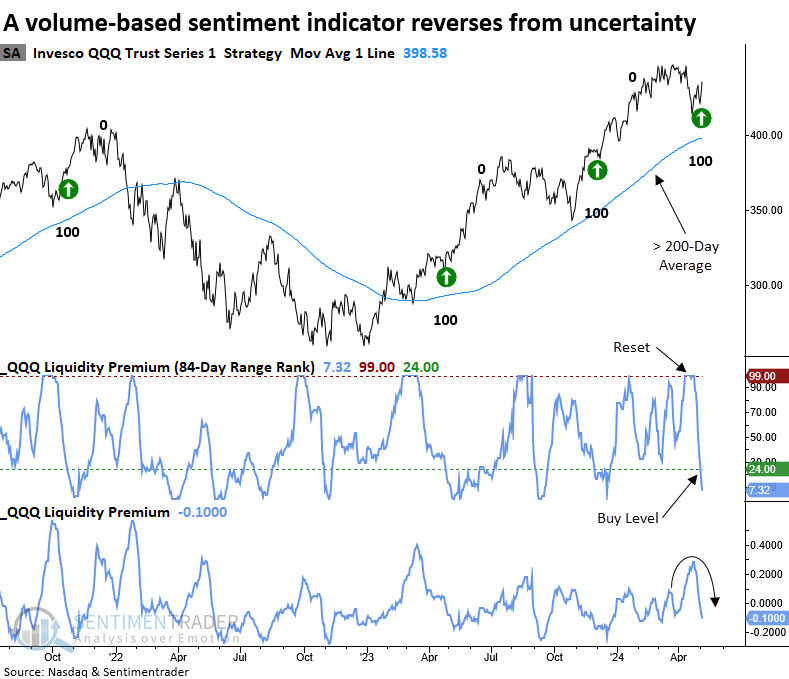
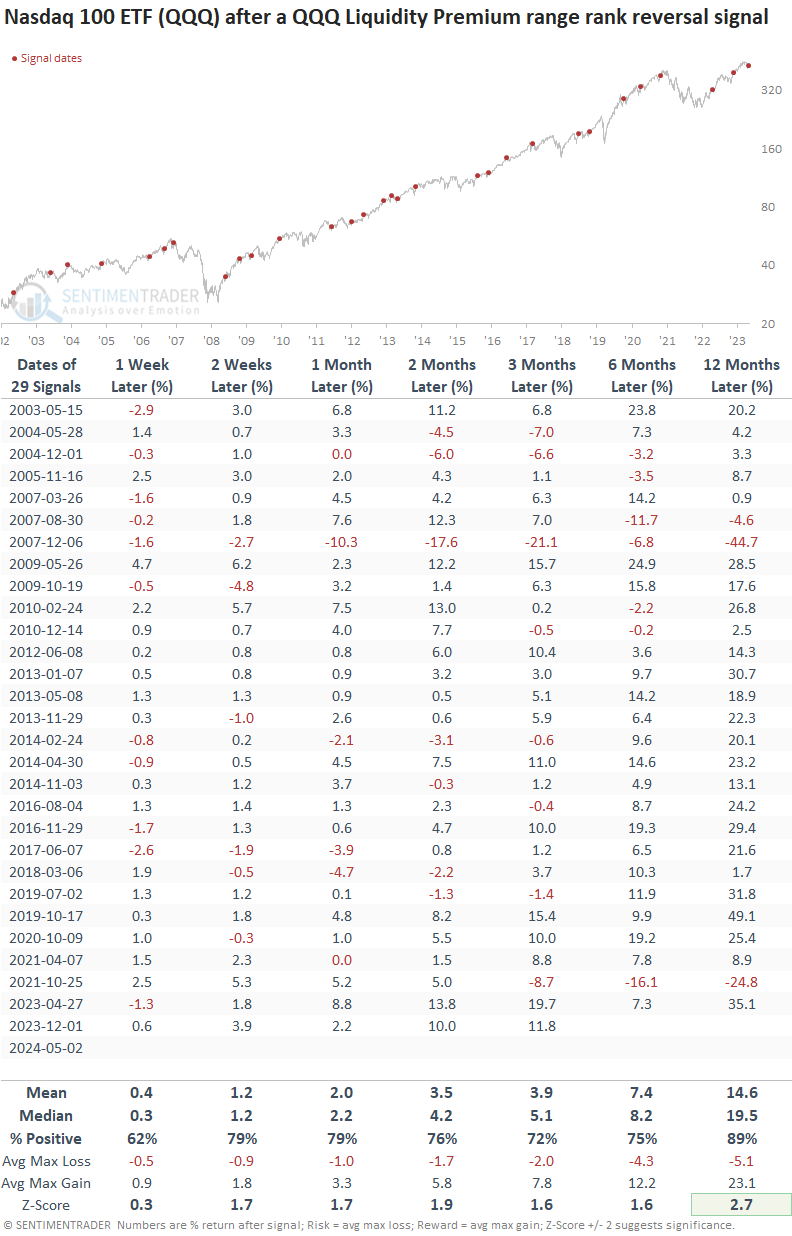
Similar volume-based sentiment shifts preceded a bullish outlook
Whenever the Liquidity Premium's 84-day range rank cycled from greater than 99% to less than 24%, with the index above its 200-day average and exhibiting positive momentum, the Nasdaq 100 ETF (QQQ) was higher 79% of the time over the subsequent month.
A sentiment gauge based on options volume
The put/call ratio is one of the more popular sentiment indicators. A high ratio suggests that investors are buying more put options compared to call options, indicating bearish sentiment. Conversely, a low put-call ratio indicates bullish sentiment, as investors favor call options.
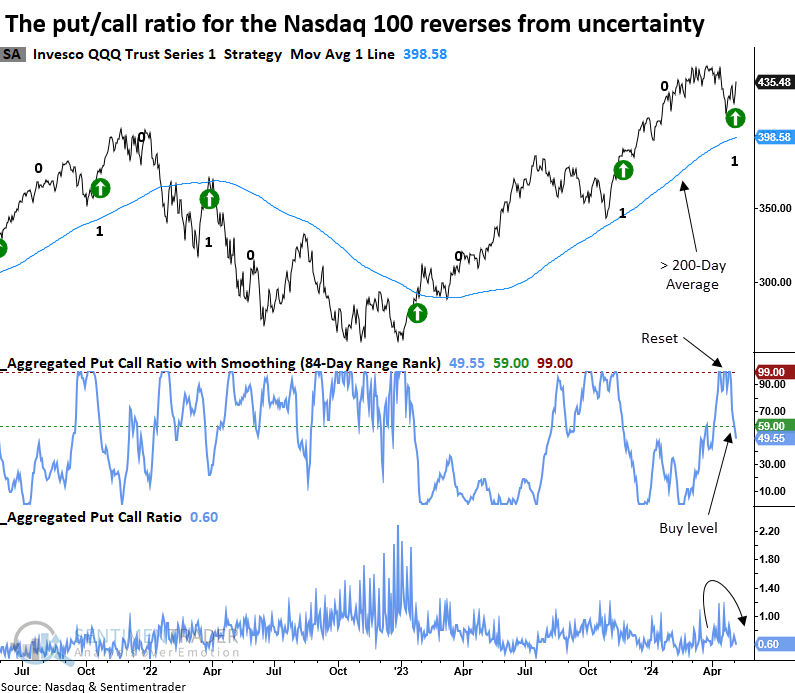
Similar options volume sentiment reversals preceded a bullish outlook
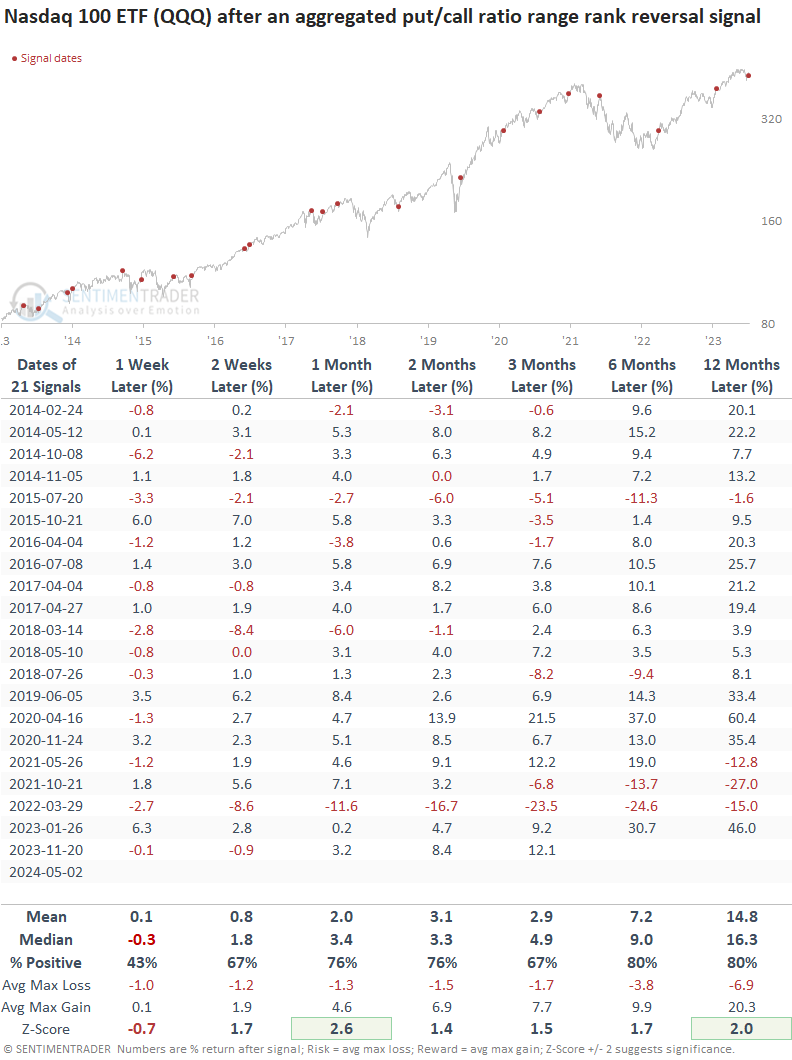
Following instances when the QQQ ETF's aggregated put/call ratio measured over an 84-day lookback cycled from greater than 99% to less than 44%, with the index above its 200-day average and exhibiting positive momentum, the popular technology-oriented ETF rallied 76% of the time over the ensuing month.
The aggregated put/call ratio data is limited. Therefore, the sample size is small.
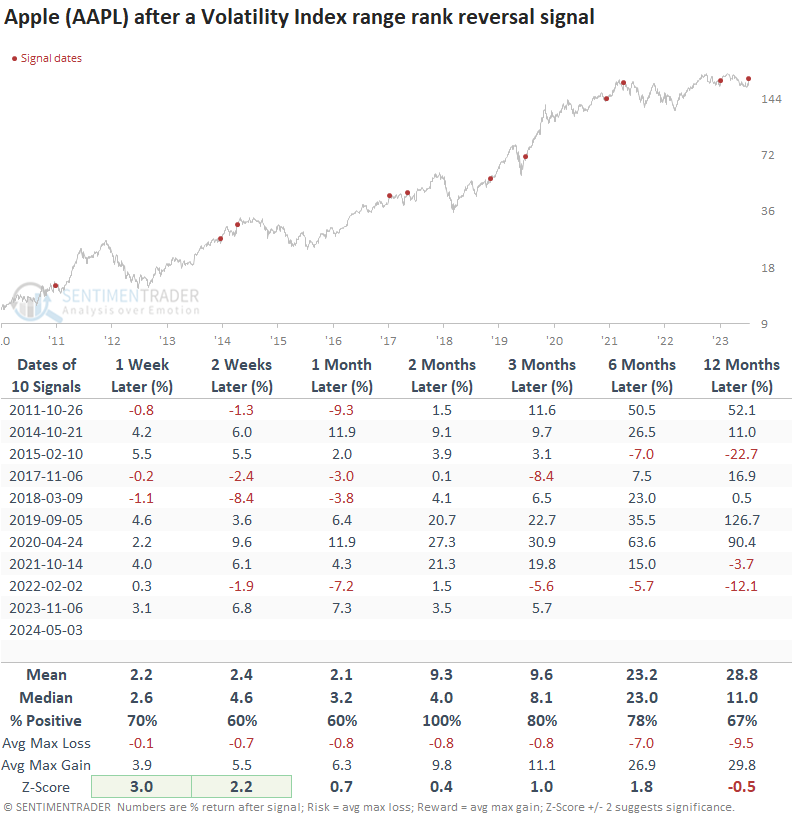
The Volatility Index for Apple
The range rank reversal concept holds relevance across various markets. The CBOE maintains a volatility index for Apple, Amazon, and other stocks. On Friday, the model triggered an alert for Apple. While data is limited, if history rhymes, one of the world's largest stocks by market capitalization could help propel the QQQ ETF higher.
What the research tells us...
Several sentiment-based indicators for the Nasdaq 100 increased to elevated levels, indicating uncertainty or fear among investors. Subsequently, these measures reversed lower, triggering buy signals for the QQQ ETF. Similar shifts in sentiment suggest a tradeable bounce that will likely continue over the following month. To be clear, this is a trade to rent, not a buy-and-hold endorsement, as relative trends for technology-oriented stocks remain unfavorable.