Data &
Technology
Research
Reports
Report Solutions
Reports Library
Actionable
Strategies
Free
Resources
Simple Backtest Calculator
Simple Seasonality Calculator
The Kelly Criterion Calculator
Sentiment Geo Map
Public Research Reports
Free Webinar
Pricing
Company
About
Meet Our Team
In the News
Testimonials
Client Success Stories
Contact
Log inLoginSign up
< BACK TO ALL REPORTS

Sentiment vs. breadth

Troy Bombardia
2020-06-19
Sentiment is a short term headwind for stocks, whereas breadth is more constructive long term.

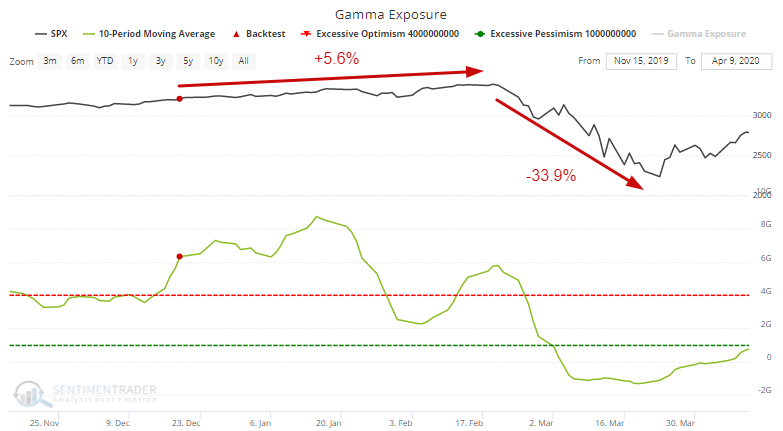
The weight of the evidence is short-medium term bearish for stocks, and longer term bullish. I looked at incredibly high Gamma Exposure more than a week ago, and after the market's plunge on June 11, Gamma Exposure is coming right back up. On a slightly longer term basis, this means that the 10 day average for Gamma Exposure is historically high (and rising).

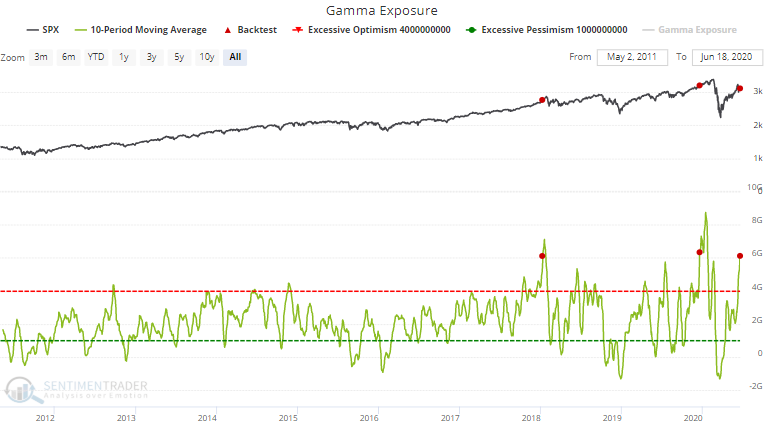
Gamma Exposure's 10 day average has only been this high 2 other times in almost 10 years: in January 2018 (before Volmageddon) and December 2019 (2 months before the March 2020 market crash).

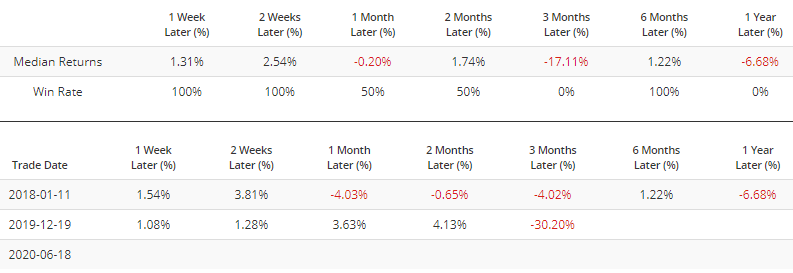
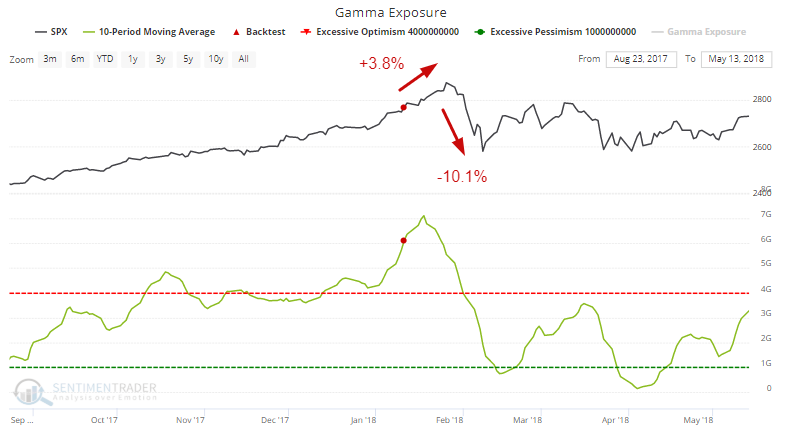
In January 2018, the S&P rallied another 3.8% before it tanked -10.1% in a matter of days:

In December 2019, the S&P rallied another 5.6% before one of the worst crashes in market history:

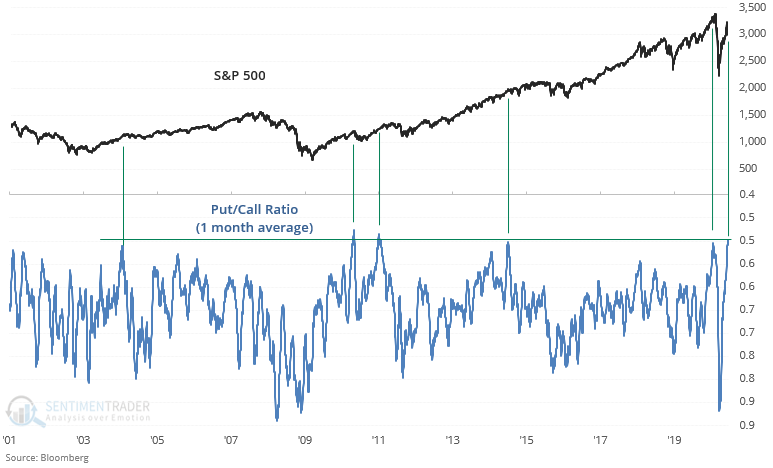
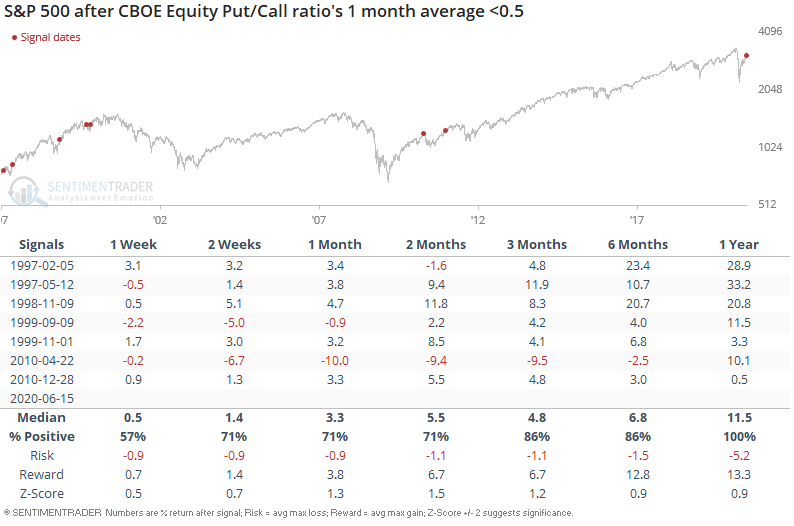
In the meantime, the Equity Put/Call ratio's 1 month average is at the 19th most overbought day in 20 years. Few days ever reached such an extreme level. This is even more extreme than at the stock market's top in February 2020. In some ways, this is an important risk for equities - monitor carefully.


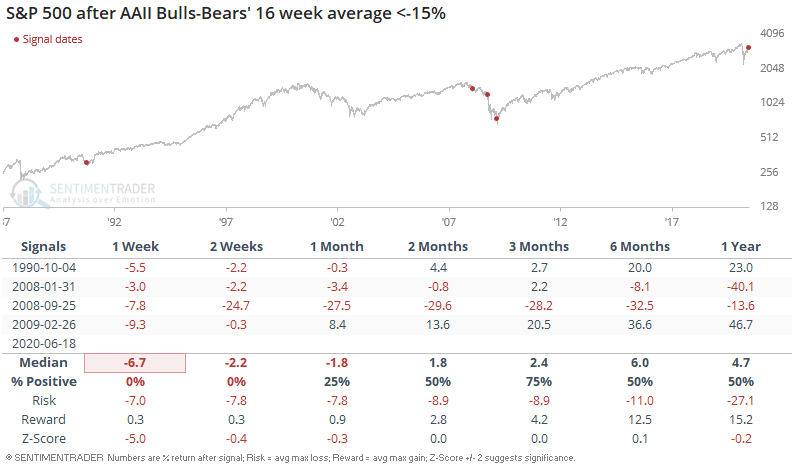
One of the few sentiment indicators not confirming the "investors are optimistic" theme is AAII. The spread between AAII Bulls and Bears is still quite low, pushing the spread's 16 week average to the lowest reading in over a decade:

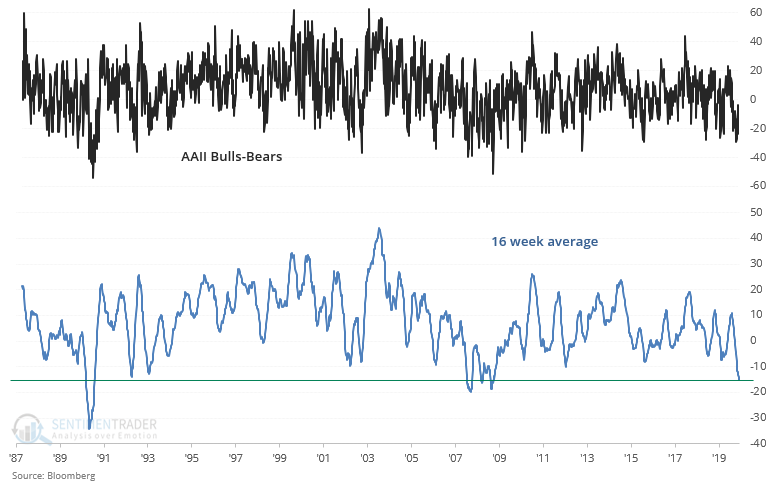
Such low "sentiment" (at least according to AAII) historically has not been a good reason to be bullish on stocks. On the contrary, this consistently led to a short term pullback in the S&P 500:

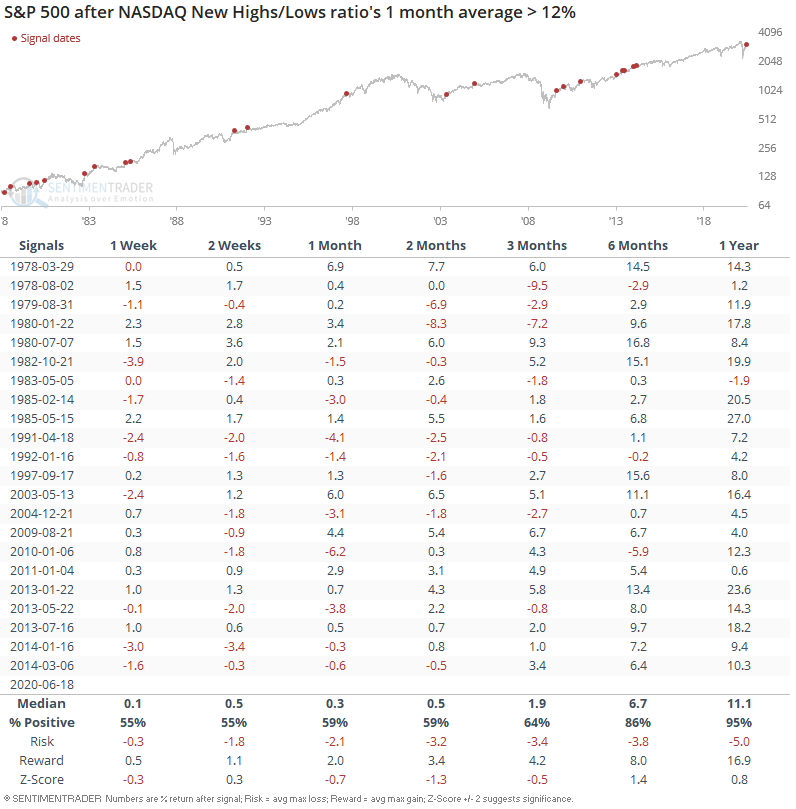
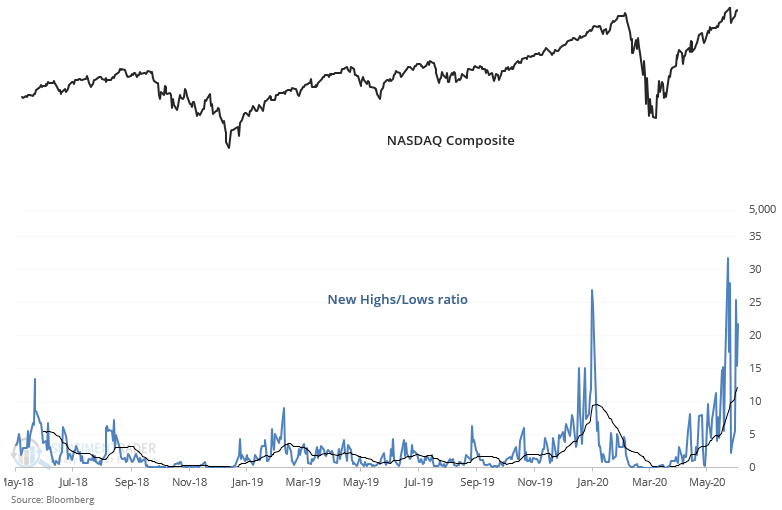
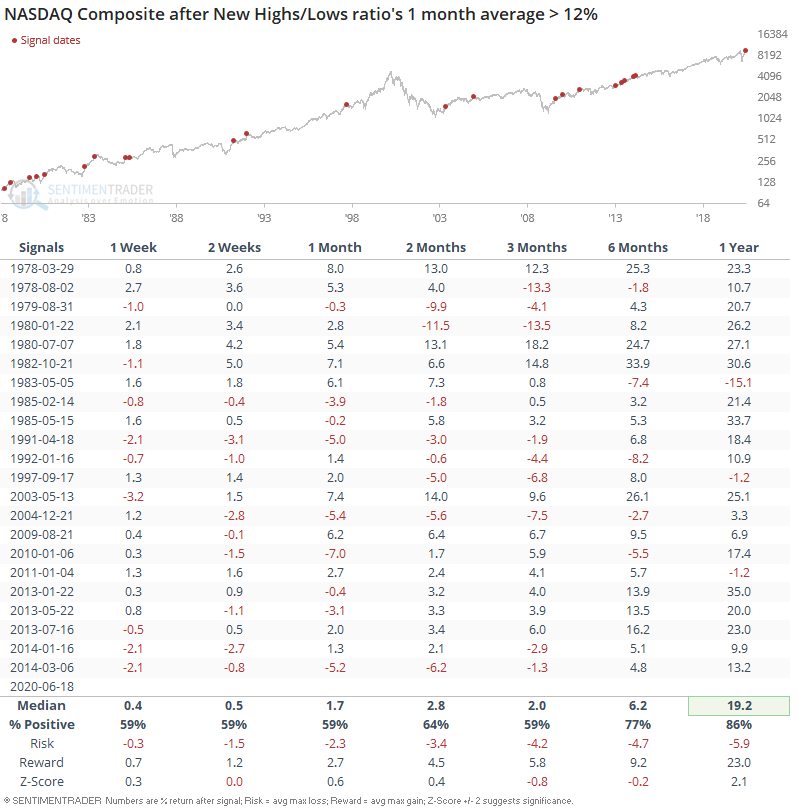
While sentiment is telling a short term bearish theme, breadth is supporting the long term bullish theme. Tech stocks' relentless surge has pushed the NASDAQ Composite's New Highs/Lows ratio higher and higher. The ratio's 1 month average is at its highest level in more than half a decade:

When the NASDAQ's breadth was this strong in the past, it could make a short term pullback (although it's hard to pinpoint exactly where). But on a longer term basis (1 year forward), this mostly led to more gains.

This had the same effect on the S&P 500 (since the NASDAQ and S&P tend to move together).

Sorry, you don't have access to this report

Upgrade your subscription plan to get access
Go to Dasboard
DATA &
TECHnologies
IndicatorEdge
‍
BackTestEdge
‍
Other Tools
‍
DataEdge API
RESEARCH
reports
Research Solution
‍
Reports Library
‍
actionable
Strategies
Trading Strategies
‍
Smart Stock Scanner
‍
FREE
RESOUrCES
Simple Backtest
Calculator
Simple Seasonality
Calculator
The Kelly Criterion
Calculator
Sentiment Geo Map
‍
Public Research Reports
‍
Free Webinar
COMPANY
‍
About
‍
Meet our Team
‍
In the News
‍
Testimonials
‍
Client Success Stories
Pricing
Bundle pricing
‍
Announcements
‍
FAQ
© 2024 Sundial Capital Research Inc. All rights reserved.
Setsail Marketing
TermsPrivacyAffiliate Program
Risk Disclosure: Futures and forex trading contains substantial risk and is not for every investor. An investor could potentially lose all or more than the initial investment. Risk capital is money that can be lost without jeopardizing ones’ financial security or life style. Only risk capital should be used for trading and only those with sufficient risk capital should consider trading. Past performance is not necessarily indicative of future results.

Hypothetical Performance Disclosure: Hypothetical performance results have many inherent limitations, some of which are described below. No representation is being made that any account will or is likely to achieve profits or losses similar to those shown; in fact, there are frequently sharp differences between hypothetical performance results and the actual results subsequently achieved by any particular trading program. One of the limitations of hypothetical performance results is that they are generally prepared with the benefit of hindsight. In addition, hypothetical trading does not involve financial risk, and no hypothetical trading record can completely account for the impact of financial risk of actual trading. for example, the ability to withstand losses or to adhere to a particular trading program in spite of trading losses are material points which can also adversely affect actual trading results. There are numerous other factors related to the markets in general or to the implementation of any specific trading program which cannot be fully accounted for in the preparation of hypothetical performance results and all which can adversely affect trading results.

Testimonial Disclosure: Testimonials appearing on this website may not be representative of other clients or customers and is not a guarantee of future performance or success.