
Sentiment trend-following with our new Sentiment Cycle Composite

Key Points
- Extremes in sentiment often signal impending turning points in price action
- Trends in sentiment can also offer helpful information between the extremes
- Our new "Sentiment Cycle Composite" may serve as a useful "weight of the evidence" tool for investors
The Sentiment Cycle Measures
In the last year, we added four "Sentiment Cycle" measures to our arsenal. The text below from our website lays the groundwork.
Human behavior is relatively constant, so many investors consider some version of the Typical Sentiment Cycle popularized by Justin Mamis in his 1999 book, The Nature of Risk. Instead of eyeballing a chart and guessing where we might be in the Cycle, we took the time period from the Mamis book. Then, we compared it to every similar Cycle since 1928 to develop an overall composite of what a Typical Sentiment Cycle has looked like over time. Each day, we use that composite and compare it to recent price action to see how correlated investor behavior is right now compared to other Cycles from the past. We take that information and calculate correlations for four different parts of the Cycle. The correlations range from -1.0 (perfect opposite) to +1.0 (perfect symmetry). In addition to a high correlation to a particular Cycle, investors should also look for behavior such as the following:
Enthusiasm: High optimism, easy credit, rush of offerings, risky stocks outperforming, stretched valuations.
Panic: Extreme pessimism, oversold breadth, risky stocks crash, negative media coverage, credit slams shut.
Discouragement: Stocks go nowhere, trend-followers suffer, there are some pockets of outperformance, credit starts to thaw, and activity slows.
Returning Confidence: Stocks rise choppily, smaller stocks do well, credit becomes easy, and more new offerings.
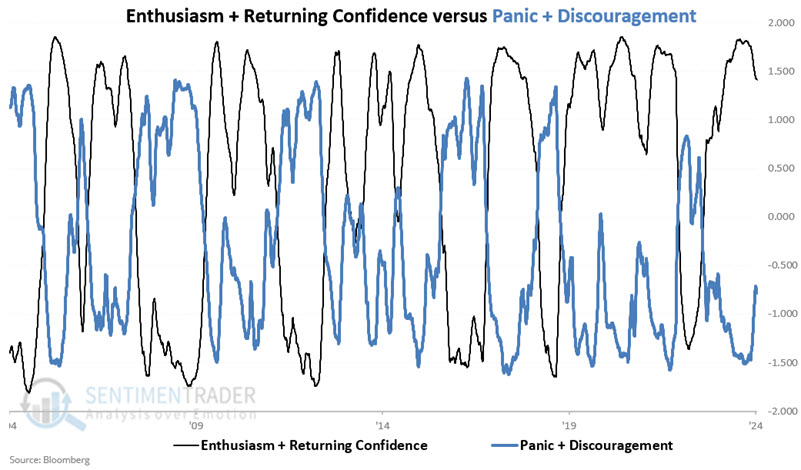
The charts below display the readings for each since 1970.
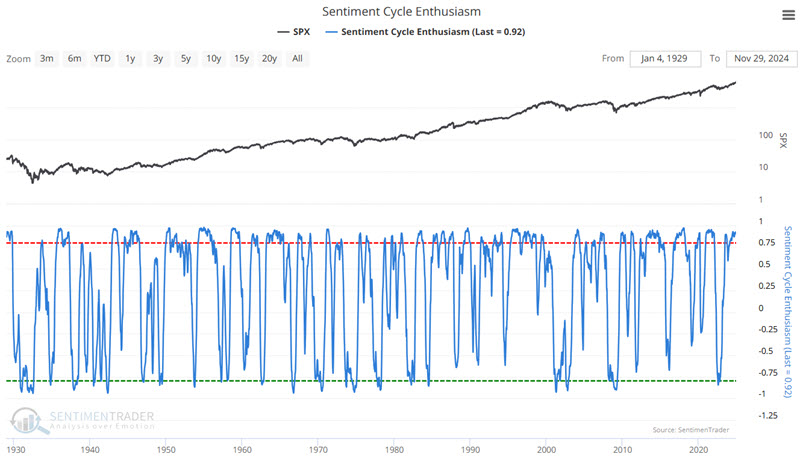
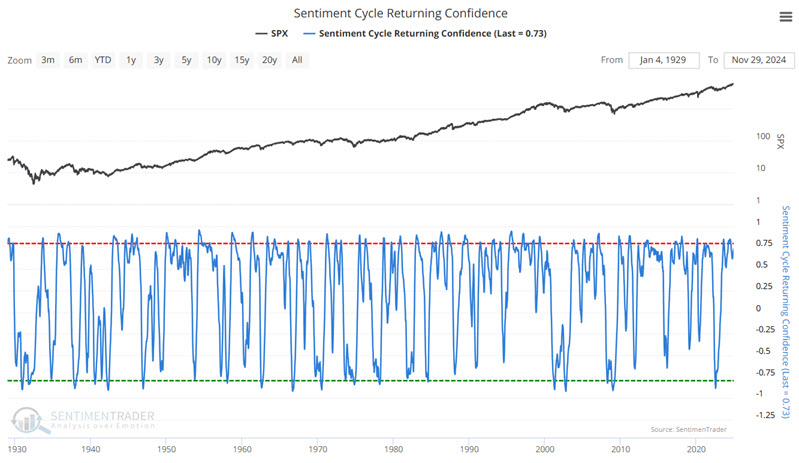
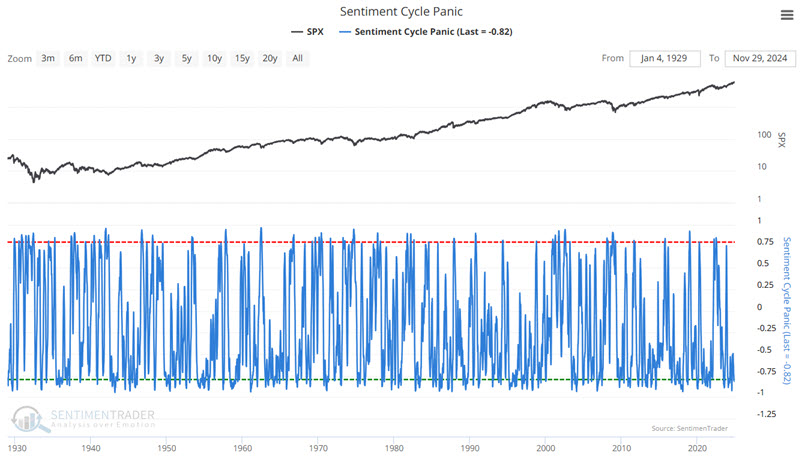
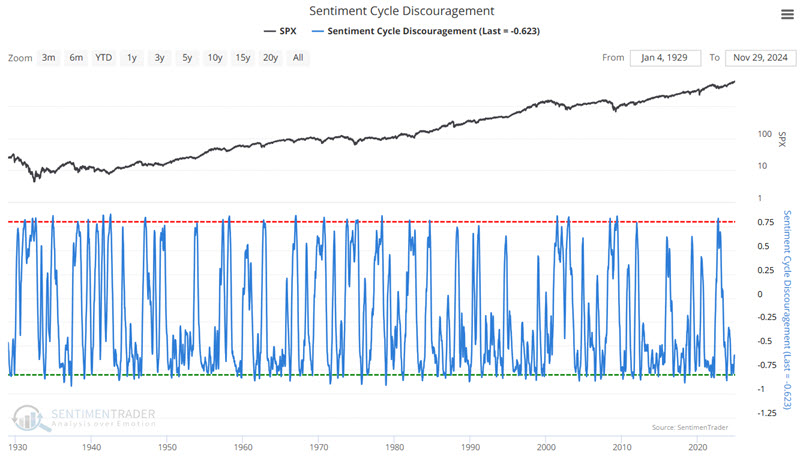
Enthusiasm and Returning Confidence tend to rise in a bullish environment and decline in a bearish environment. Panic and Discouragement tend to do just the opposite.
Introducing the Sentiment Cycle Composite indicator indicator
Let's combine these four sentiment cycle values to create one Sentiment Cycle Composite. The Sentiment Cycle Composite is calculated as follows:
A = Sentiment Cycle Enthusiasm
B = Sentiment Cycle Returning Confidence
C = Sentiment Cycle Discouragement
D = Sentiment Cycle Panic
E = (A + B)
F = (C + D)
G = E - F
Sentiment Cycle Composite = G
As of 2024-11-29:
A = 0.921
B = 0.730
C = (-0.623)
D = (-0.820)
E = 0.921 + 0.730 = 1.651
F = -0.623 + - 0.82 = -1.443
G = 1.651 - (-1.443) = 3.094
Sentiment Cycle Composite = 3.094
The chart below displays Variable E and F over the past twenty years.
So, to arrive at the daily Sentiment Cycle Composite value, we subtract Variable F from Variable E, as shown in the chart below.
Using the Sentiment Cycle Composite as weight of the evidence
First, please note that the Sentiment Cycle Composite is a new indicator and that future research may reveal more sophisticated and effective uses for it than what is detailed herein. For now, it is best used as a weight of the evidence indicator and not necessarily as a standalone model. To foreshadow the initial conclusions, the stock market is much more likely to be in a bull market when the Sentiment Cycle Composite is above -0.6 than when it is below -0.6.
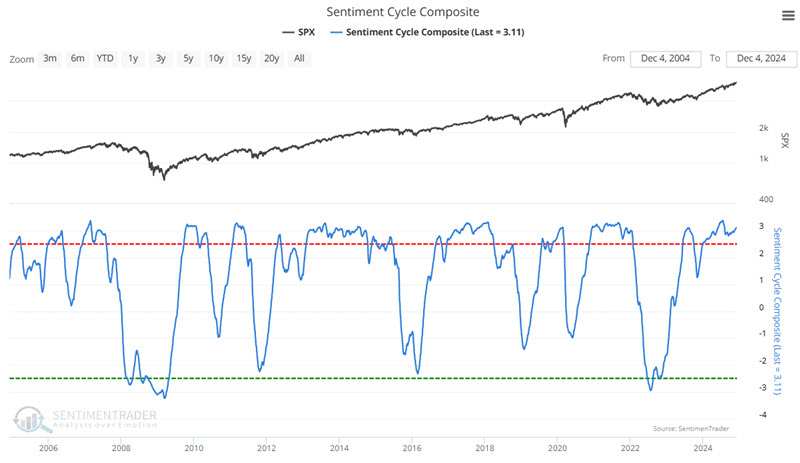
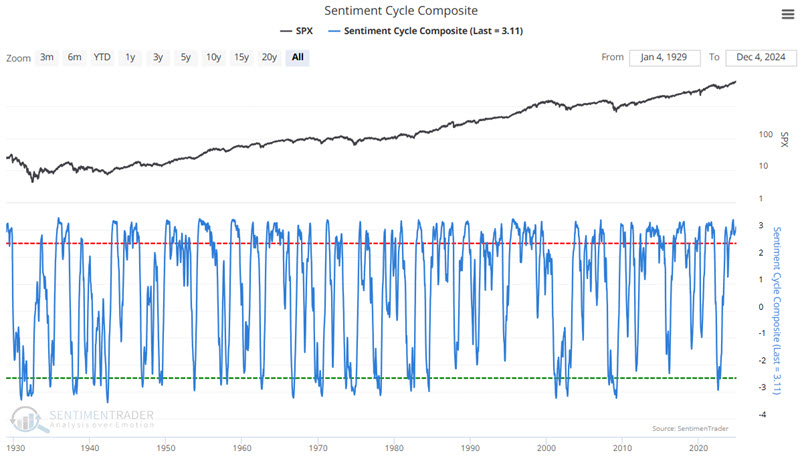
The chart below displays the Sentiment Cycle Composite value for each day since 1970-01-02, with the -0.6 cutoff also highlighted.
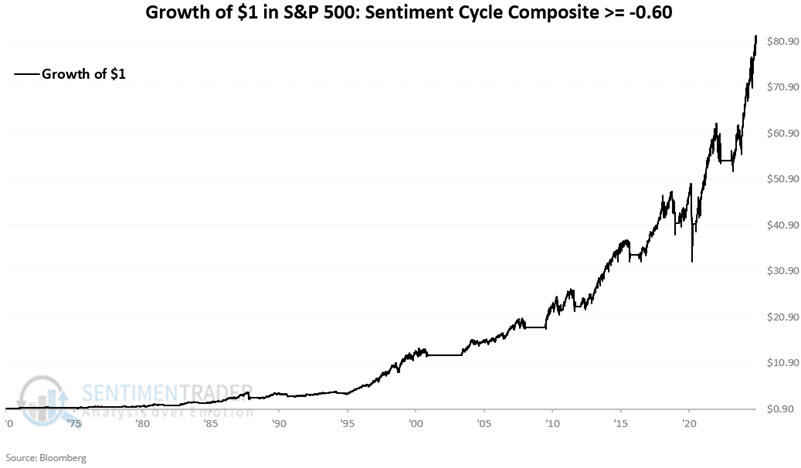
The chart below displays the hypothetical growth of $1 invested in the S&P 500 only when the Sentiment Cycle Composite was at or above -0.60.
The chart below displays the same results on a logarithmic scale.
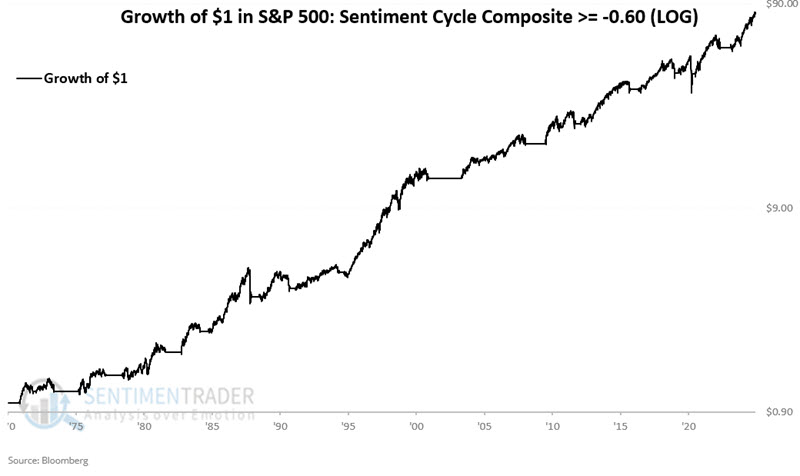
From 1970-01-02 through 2024-11-29, a hypothetical $1 invested in the S&P 500 only when the Sentiment Cycle Composite was above -0.60 grew +8,092% to $81.92.
The chart below displays the hypothetical growth of a hypothetical $1 invested in the S&P 500 only when the Sentiment Cycle Composite was below -0.60.
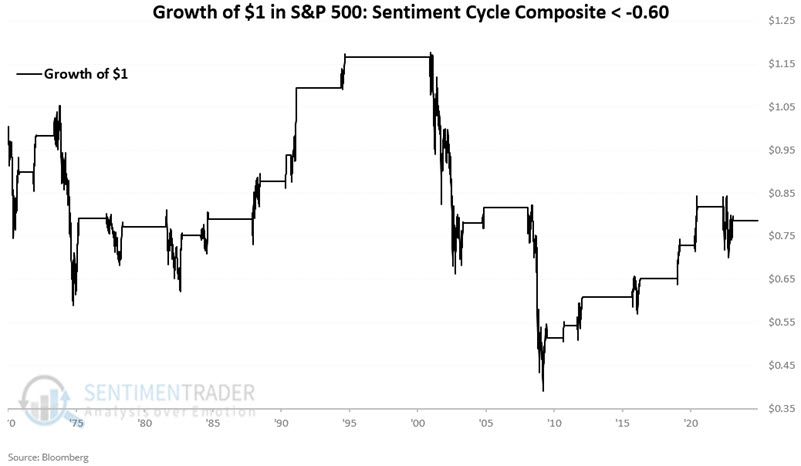
From 1970-01-02 through 2024-11-29, $1 invested in the S&P 500 only when the Sentiment Cycle Composite was below -0.60 declined -21% to $0.79.
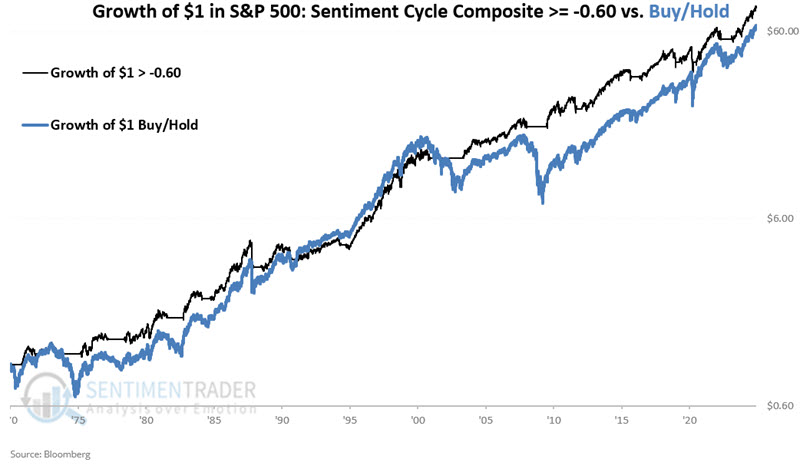
The chart below displays a logarithmic depiction of the growth of $1 using the -0.60 cutoff and $1 in the S&P 500 on a buy-and-hold basis. A visual perusal of the chart above reveals several instances when the drawdown size was not as deep using the -0.60 cutoff level as an exit trigger versus buying-and-holding.
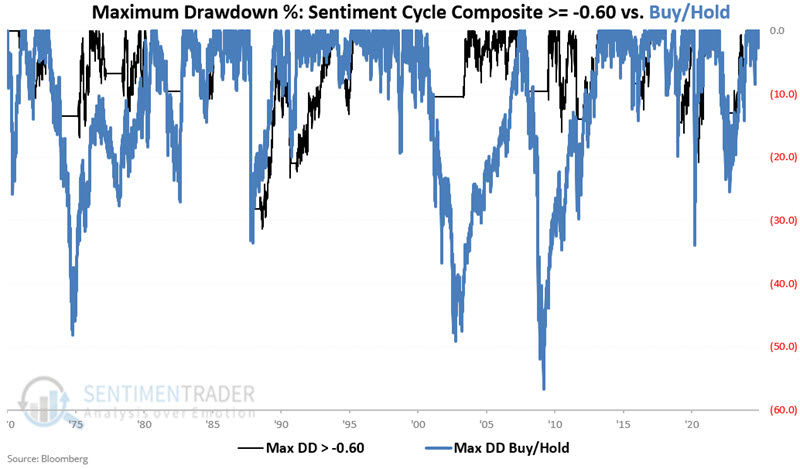
The chart below displays the maximum percentage drawdown for $1 invested in the S&P 500 only when the Sentiment Cycle Composite was above -0.60 (black line) versus the maximum percentage drawdown for $1 invested in the S&P 500 on a buy-and-hold basis (blue line). The strategy method experienced a maximum drawdown of -33.9% and the buy-and-hold method experienced a maximum drawdown of -56.8%. During virtually all major bear market declines, the strategy method experienced a less significant drawdown than the buy-and-hold approach.
Summarizing hypothetical historical results
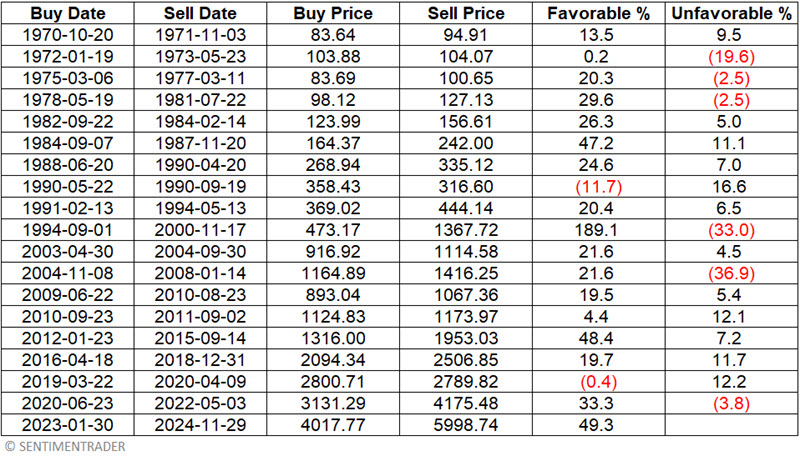
The table below displays all favorable and unfavorable periods. Favorable periods are when the Sentiment Cycle Composite is >= -0.60, and unfavorable periods are when the value is below -0.60. As of 2024-11-29, the Sentiment Cycle Composite is +3.094, so the date of 2024-11-29 in the last line of the table below represents the last date of the test and NOT the end of the current favorable period.
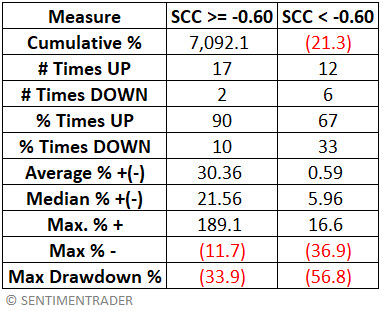
The table below summarizes performance during favorable periods versus unfavorable periods. Investors should note that twelve of the eighteen supposedly unfavorable periods saw the S&P 500 register a gain. So, it may be a mistake to label readings below -0.60 as outright "bearish." Nevertheless, it is also clear that the S&P 500 performance was vastly superior when the Sentiment Cycle Composite was above -0.60, and the bulk of all major bear markets played out while the indicator was below -0.60.
What the research tells us...
The Sentiment Cycle Composite indicator is comfortably in favorable territory at 3.09, well above the -0.60 cutoff level. Does this mean "smooth sailing" for stocks? Not at all. It simply tells us that one objective measure of sentiment trend presently remains on the favorable side of the "weight of the evidence" ledger.