Data &
Technology
Research
Reports
Report Solutions
Reports Library
Actionable
Strategies
Free
Resources
Simple Backtest Calculator
Simple Seasonality Calculator
The Kelly Criterion Calculator
Sentiment Geo Map
Public Research Reports
Free Webinar
Pricing
Company
About
Meet Our Team
In the News
Testimonials
Client Success Stories
Contact
Log inLoginSign up
< BACK TO ALL REPORTS

Sentiment Isn't Yet the Support It Needs To Be

Jason Goepfert
2021-07-20
Despite recent record highs and still limited losses in stocks, the Fear & Greed model has declined and is approaching Fear territory. These divergences are not necessarily a good sign. Monday's weakness was enough to push Dumb Money below Smart Money Confidence.

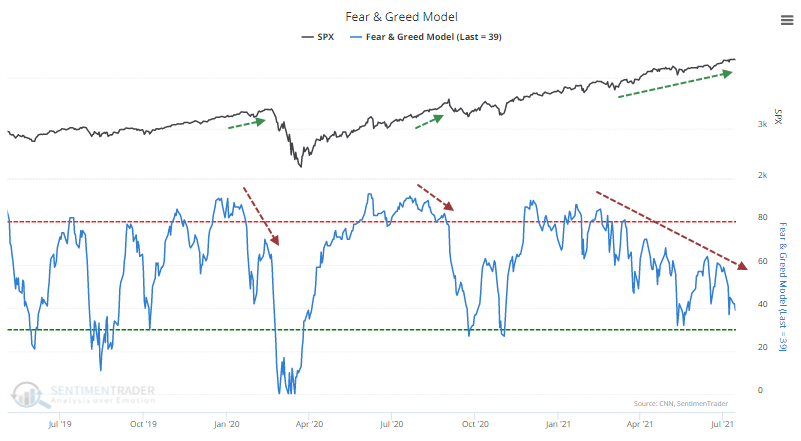
Investors are already fearful, and that has to be a good sign for stocks.

That's the theory being bandied about regarding the CNN Fear & Greed model. The news organization's sentiment measure has been sliding lower for weeks and is nearing a level considered to show fear.

We used their publicly revealed inputs to recreate the model, though to generate more history and hopefully more accuracy, we use different inputs for high-yield bonds and put/call ratios. There is about a 95% correlation between the two versions.

Unlike at market bottoms, sentiment often peaks well ahead of prices. Investors become euphoric, push prices higher, then gradually lose interest. Bull markets need steadily rising optimism to continue rising, so this is an issue.

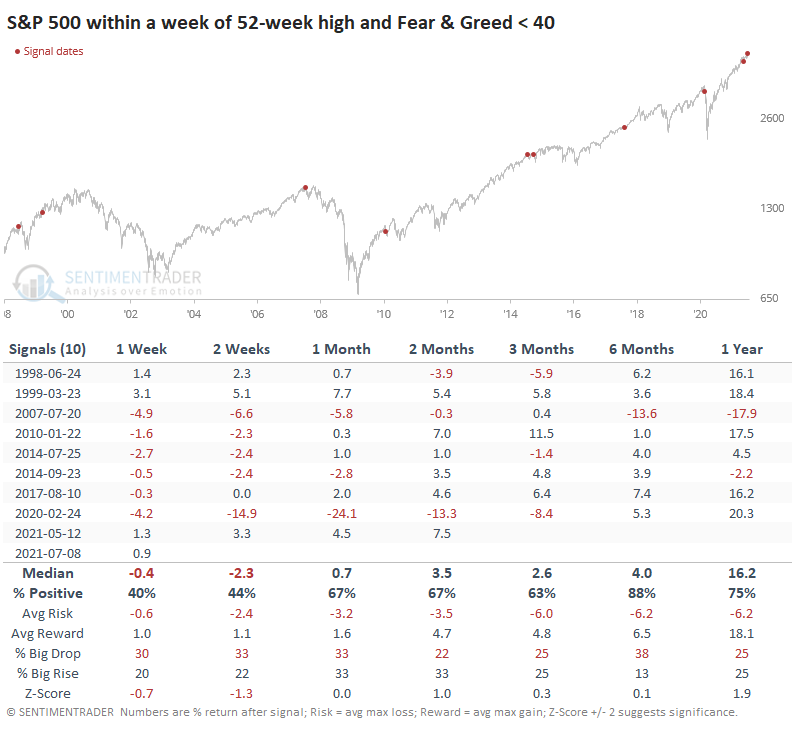
WHAT IT SUGGESTS FOR FUTURE RETURNS

When we look at the numbers, we can see why declining Greed is not necessarily a good thing. The table below shows every time since 1998 when the S&P 500 had been at a 52-week high within the past week, and Fear & Greed fell below 40.

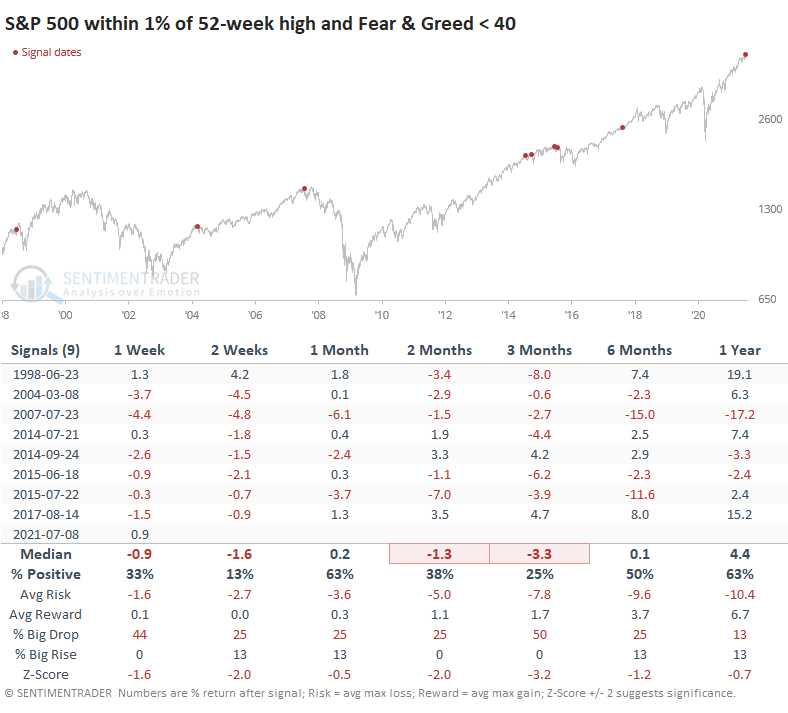
That's not terrible, though short-term returns were weak. How about when the model fell below 40 but the S&P was still within 1% of its high at the time? Here, not so good.

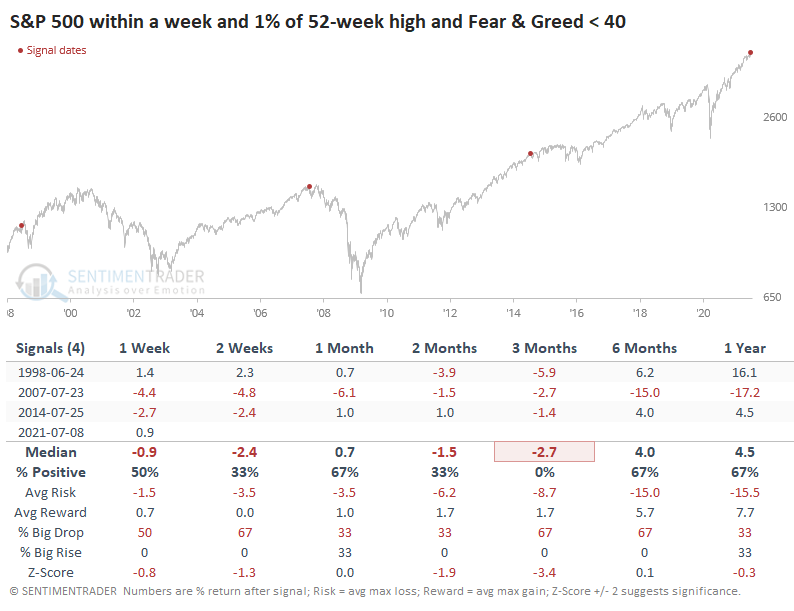
And when both conditions trigger, there were only three precedents, none of them good. The signal from August 2017 only missed triggered by a fraction, though, so that would have been a pretty big exception.

It's been a couple of weeks since this one triggered, and we've seen the expected weakness. If it plays nicely with historical precedent, then there should be more weakness still to come.

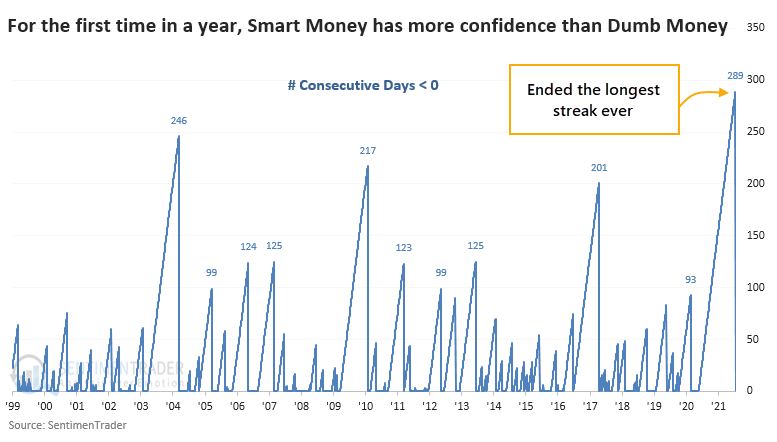
FINALLY, DUMB MONEY CONFIDENCE < SMART MONEY

What we saw on Monday was enough to finally push Dumb Money Confidence below Smart Money Confidence for the first time in over a year, so the spread finally turned positive (the chart below has an inverted scale).

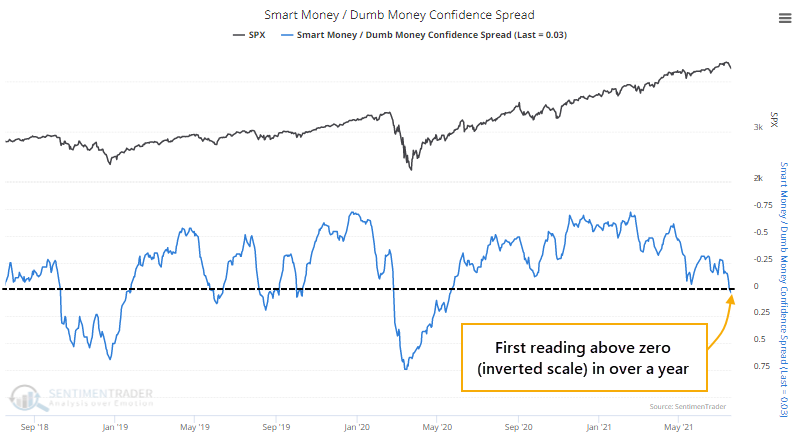
This just ended the longest-ever streak with the opposite condition. No other period went more than a year.

The first time that the Confidence Indexes flipped in more than 90 days, the S&P 500 tended to see continued short-term weakness but showed very strong longer-term returns.

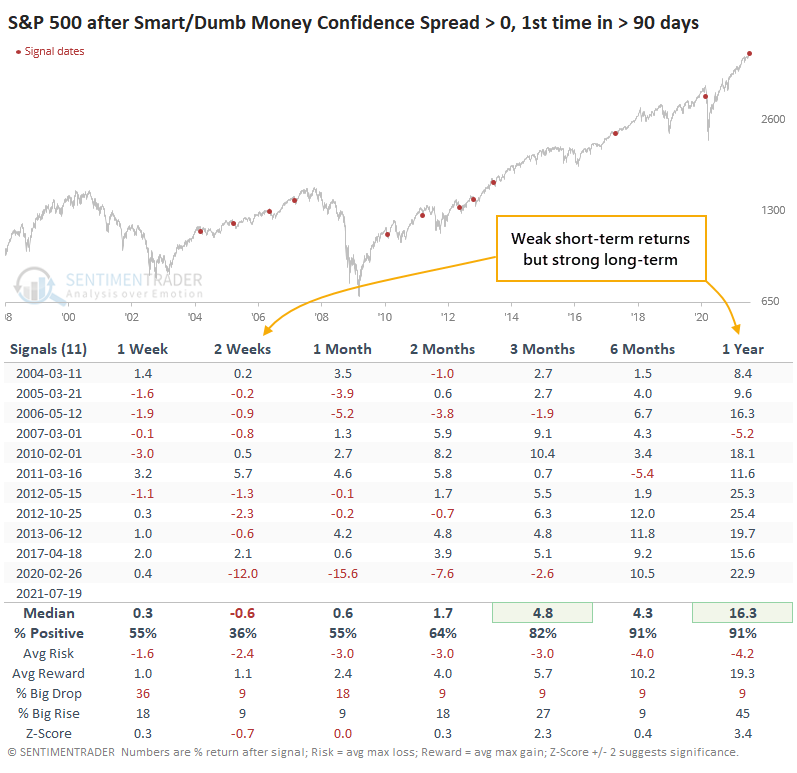
The weakening breadth we've been highlighting has a strong tendency to lead to weak short- to medium-term returns. And the strong momentum in the first half of the year has an even stronger tendency to lead to higher medium- to long-term returns. The flip in Confidence seen above is further support to both arguments.

Sorry, you don't have access to this report

Upgrade your subscription plan to get access
Go to Dasboard
DATA &
TECHnologies
IndicatorEdge
‍
BackTestEdge
‍
Other Tools
‍
DataEdge API
RESEARCH
reports
Research Solution
‍
Reports Library
‍
actionable
Strategies
Trading Strategies
‍
Smart Stock Scanner
‍
FREE
RESOUrCES
Simple Backtest
Calculator
Simple Seasonality
Calculator
The Kelly Criterion
Calculator
Sentiment Geo Map
‍
Public Research Reports
‍
Free Webinar
COMPANY
‍
About
‍
Meet our Team
‍
In the News
‍
Testimonials
‍
Client Success Stories
Pricing
Bundle pricing
‍
Announcements
‍
FAQ
© 2024 Sundial Capital Research Inc. All rights reserved.
Setsail Marketing
TermsPrivacyAffiliate Program
Risk Disclosure: Futures and forex trading contains substantial risk and is not for every investor. An investor could potentially lose all or more than the initial investment. Risk capital is money that can be lost without jeopardizing ones’ financial security or life style. Only risk capital should be used for trading and only those with sufficient risk capital should consider trading. Past performance is not necessarily indicative of future results.

Hypothetical Performance Disclosure: Hypothetical performance results have many inherent limitations, some of which are described below. No representation is being made that any account will or is likely to achieve profits or losses similar to those shown; in fact, there are frequently sharp differences between hypothetical performance results and the actual results subsequently achieved by any particular trading program. One of the limitations of hypothetical performance results is that they are generally prepared with the benefit of hindsight. In addition, hypothetical trading does not involve financial risk, and no hypothetical trading record can completely account for the impact of financial risk of actual trading. for example, the ability to withstand losses or to adhere to a particular trading program in spite of trading losses are material points which can also adversely affect actual trading results. There are numerous other factors related to the markets in general or to the implementation of any specific trading program which cannot be fully accounted for in the preparation of hypothetical performance results and all which can adversely affect trading results.

Testimonial Disclosure: Testimonials appearing on this website may not be representative of other clients or customers and is not a guarantee of future performance or success.