Products
SentimenTrader Trading Tools
‍
Backtest Engine
My Trading Toolkit
Correlation Analysis
Seasonality
Indicators & Data API
‍
Proprietary Indicators & Charts
Market Data API
Strategies & Scanner
‍
50+ Trading Strategies
Smart Stock Scanner
Research Reports
‍
Research Solutions
Reports Library
Free Resources
Simple Backtest Calculator
Simple Seasonality Calculator
The Kelly Criterion Calculator
Sentiment Geo Map
Public Research Reports
Pricing
Company
About
In the News
Testimonials
Client Success Stories
Contact
Log inLoginSign up
< BACK TO ALL REPORTS

Sentiment is washed out

Jason Goepfert
2022-05-11
The spread between Dumb Money and Smart Money Confidence has widened to an extreme, as Dumb Money has plunged to one of the lowest levels in 23 years. Stocks have consistently rebounded over the next couple of months after similar extremes, even during protracted bear markets.

Key points:

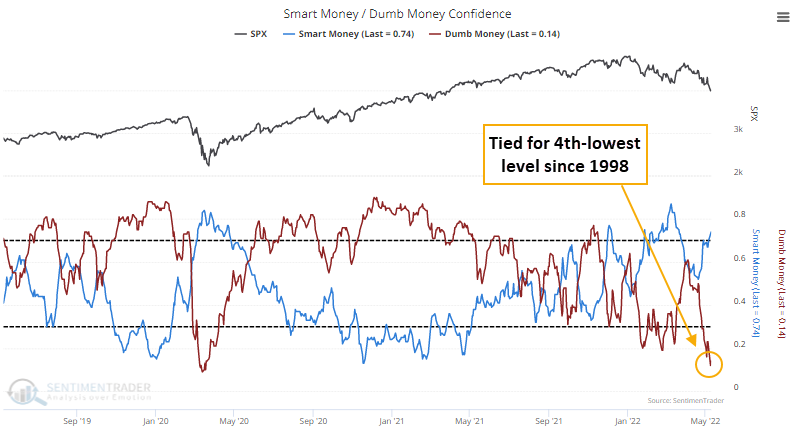
  • Dumb Money Confidence in a stock market rallied has plunged to one of the lowest levels in 23 years
  • Smart Money Confidence has rebounded, and the spread between the models is wide
  • While there can be short-term losses, stocks have consistently rallied after similar extremes

Sentiment has reached the tipping point

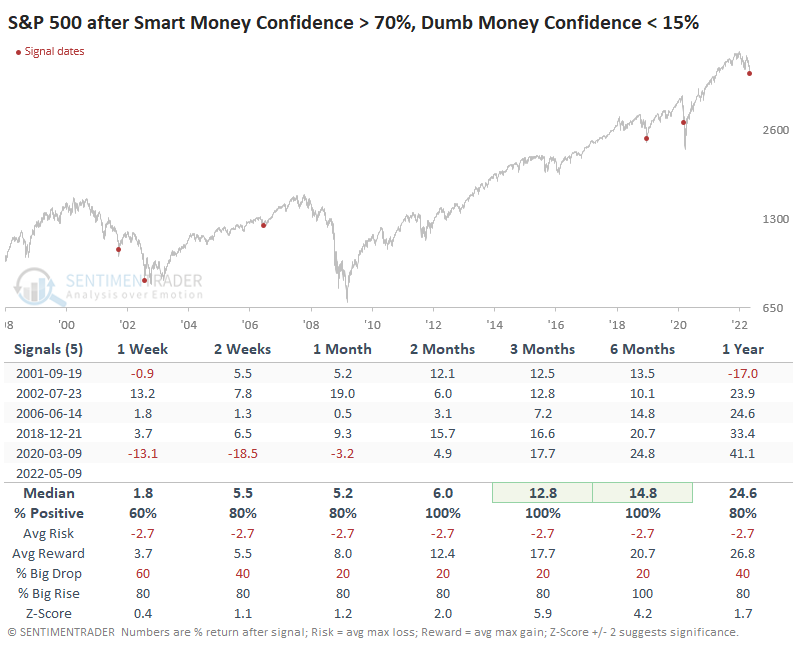
The Dumb Money is panicking while the Smart Money is buying. For only the 11th time since we began calculating it in 1998, Dumb Money Confidence in a rally fell to only 12% on Monday. After all ten of the other readings, stocks rallied by double digits in the months ahead.

At the same time, Smart Money Confidence has climbed well above 70%.

For Dumb Money Confidence to get this low, there has to be widespread evidence of deep pessimism. And there is - selling is occurring across a broad swath of stocks, many are being pushed to new lows, equity funds are seeing outflows, sentiment surveys are at levels seen during the depths of recessions, traders are making speculative bets on a market crash, and higher-risk markets are being sold hard.

There have only been a handful of times both indicators were at such opposite extremes simultaneously.

At various times, either Dumb Money Confidence or Smart Money Confidence is at more of an extreme than the other is. So even if one side isn't particularly stretched, the spread between them could be. Because of the wide moat between the two Confidence indexes, that spread is now wider than +60%.

The Backtest Engine shows that some readings above +60% occurred during protracted bear markets. Even so, the S&P 500 sported a positive return over the next two months after 82 out of 87 days. The losses were all small: -1.2%, -2.3%, -0.7%, -1.0%, and -1.5%.

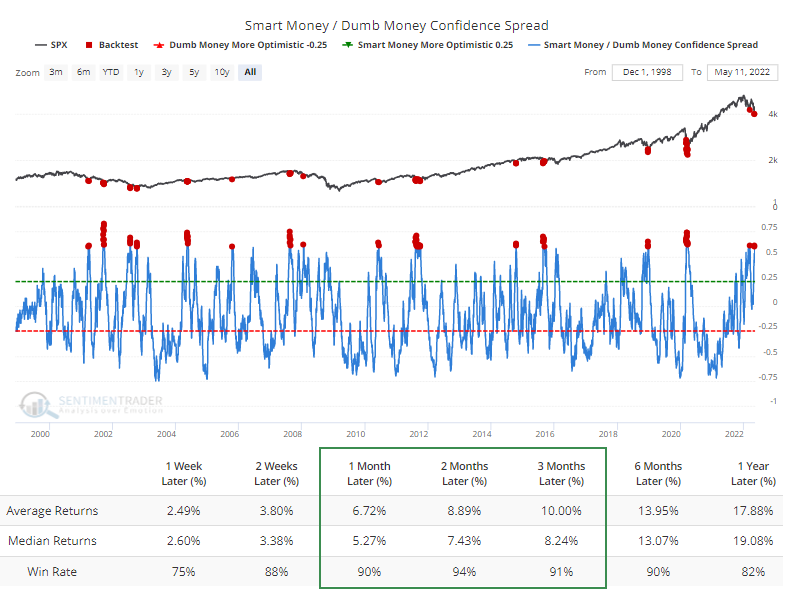
Granted, that looks great in hindsight. But the pandemic crash was exceedingly painful. The spread rose above 60% on March 9, 2020, after which the S&P 500 lost an additional 22% in the next couple of weeks.

There is always a tradeoff between buying when others are panicking and waiting until things calm down. The former strategy allows for a high win rate (with patience) and high returns, but also high risk during those few times when markets truly crash. The latter strategy allows for lower risk because the panic has (probably) already passed, but with the risk of smaller losses as markets fall back and test a low.

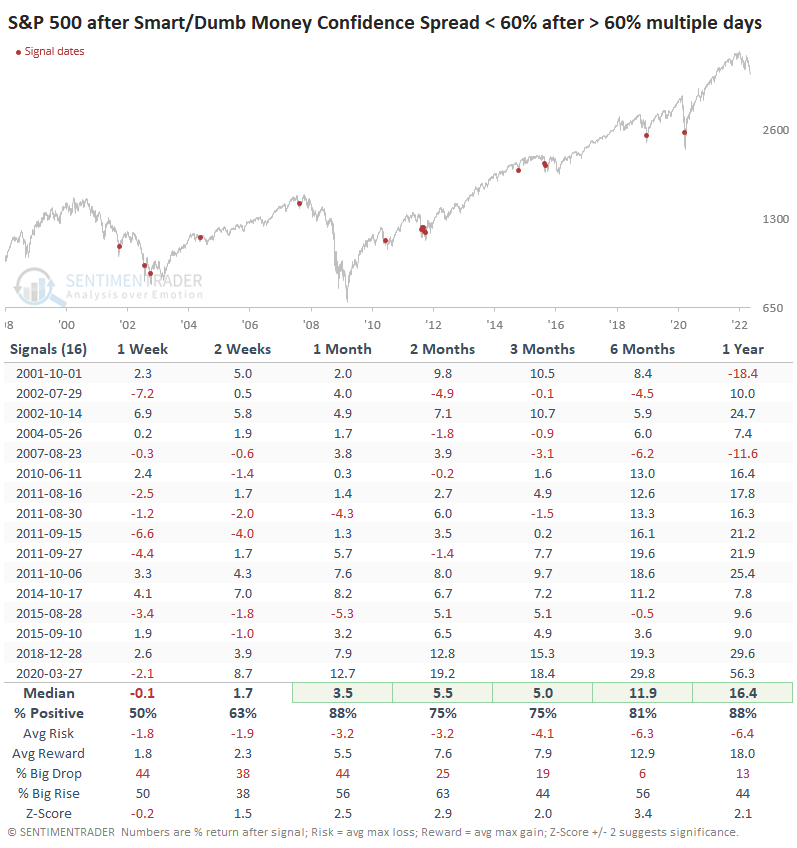
If we look for times when the spread exceeded 60% for at least a couple of days and then fell below 60% for a couple of sessions, we can see the phenomenon in action. The S&P 500 continued to rally with consistency in the months ahead, with no massive losses at any point in the next couple of months, but gains were also more subdued.

What the research tells us...

This is an unhealthy market environment, so we should require extreme sentiment readings across a wide variety of measures to have any confidence in a market rebound. And even then, our expectations should be moderate, betting on a multi-week or multi-month relief of the pessimism, not necessarily a lasting low. Until this week, we hadn't really seen those true extremes. We have not yet seen actual capitulation, which would present a more compelling case that stocks had reached a bear market bottom. So any potential relief rally from the current deep pessimism would be just that, a relief rally.

Sorry, you don't have access to this report

Upgrade your subscription plan to get access
Go to Dasboard
PRODUCTS
SentimenTrader
Trading Tools
Indicators & Data API
‍
Strategies & Scanner
‍
Research Reports
FREE
RESOUrCES
Simple Backtest
Calculator
Simple Seasonality
Calculator
The Kelly Criterion
Calculator
Sentiment Geo Map
‍
Public Research Reports
‍
Pricing
Bundle pricing
‍
Announcements
‍
FAQ
COMPANY
‍
About
‍
In the News
‍
Testimonials
‍
Client Success Stories
CONTACT
‍
General Inquiries
‍
Media Inquiries
‍
Financial Professionals Inquiries
‍
© 2025 Sundial Capital Research Inc. All rights reserved.
Setsail Marketing
TermsPrivacyAffiliate Program
Risk Disclosure: Futures and forex trading contains substantial risk and is not for every investor. An investor could potentially lose all or more than the initial investment. Risk capital is money that can be lost without jeopardizing ones’ financial security or life style. Only risk capital should be used for trading and only those with sufficient risk capital should consider trading. Past performance is not necessarily indicative of future results.

Hypothetical Performance Disclosure: Hypothetical performance results have many inherent limitations, some of which are described below. No representation is being made that any account will or is likely to achieve profits or losses similar to those shown; in fact, there are frequently sharp differences between hypothetical performance results and the actual results subsequently achieved by any particular trading program. One of the limitations of hypothetical performance results is that they are generally prepared with the benefit of hindsight. In addition, hypothetical trading does not involve financial risk, and no hypothetical trading record can completely account for the impact of financial risk of actual trading. for example, the ability to withstand losses or to adhere to a particular trading program in spite of trading losses are material points which can also adversely affect actual trading results. There are numerous other factors related to the markets in general or to the implementation of any specific trading program which cannot be fully accounted for in the preparation of hypothetical performance results and all which can adversely affect trading results.

Testimonial Disclosure: Testimonials appearing on this website may not be representative of other clients or customers and is not a guarantee of future performance or success.