Sentiment indicators as trend following models
Over the past 2 years sentiment has had a habit of staying at extreme readings for longer periods of time. So perhaps instead of going contrarian when sentiment hits an extreme, perhaps it's better to wait for sentiment to hit extreme readings and then reverse (i.e. trend follow). This post looks at various sentiment indicators from a simple trend following perspective:
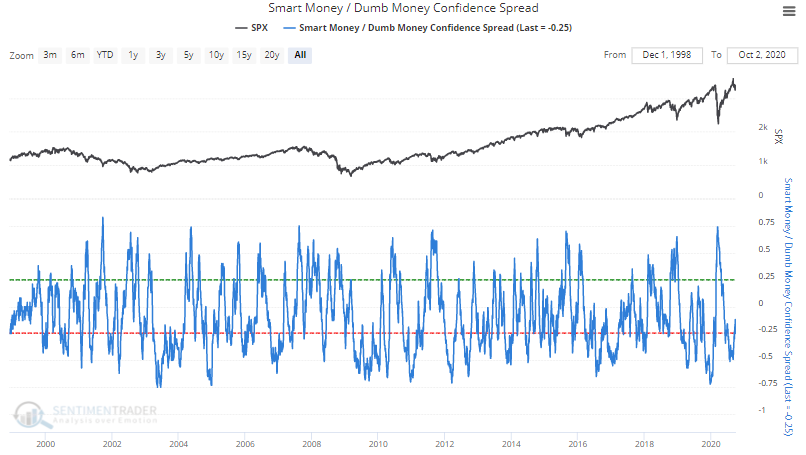
Smart/Dumb Money Confidence Spread
In this simple strategy, go long the S&P 500 when the Smart/Dumb Money Confidence Spread is below a certain moving average ("X"), otherwise shift to 100% cash.
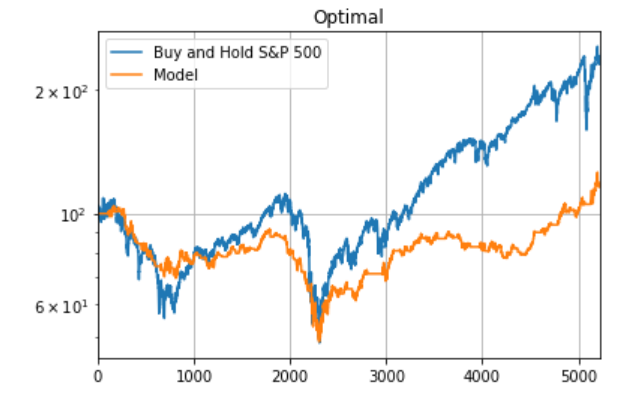
The optimal moving average is 6 days. I.e. go long the S&P 500 when the Smart/Dumb Money Confidence Spread is below its 6 day moving average, otherwise shift to 100% cash.
- Buy and hold the S&P 500 yields an average of 4.47% per year
- This strategy yields an average of 4.21% per year
Here's the returns chart:
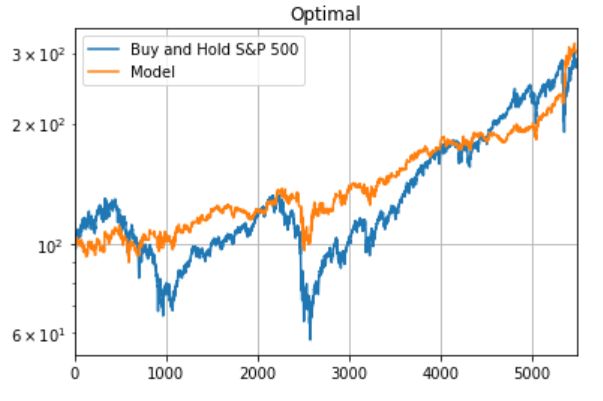
Intermediate Term Optimism Index
In this simple strategy, go long the S&P 500 when the Intermediate Term Optimism Index is above a certain moving average ("X"), otherwise shift to 100% cash.
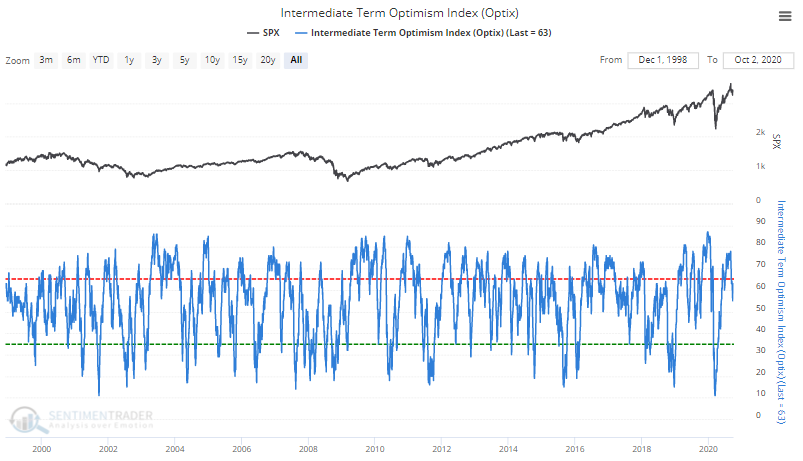
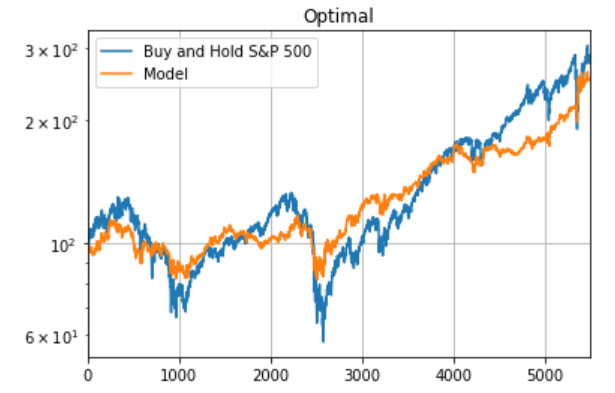
The optimal moving average is 14 days. I.e. go long the S&P 500 when the Intermediate Term Optimism Index is above its 14 day moving average, otherwise shift to 100% cash.
- Buy and hold the S&P 500 yields an average of 4.47% per year
- This strategy yields an average of 5.54% per year
Here's the returns chart:
CNN Fear/Greed Proxy
In this simple strategy, go long the S&P 500 when our proxy for the CNN Fear/Greed indicator is above a certain moving average ("X"), otherwise shift to 100% cash.
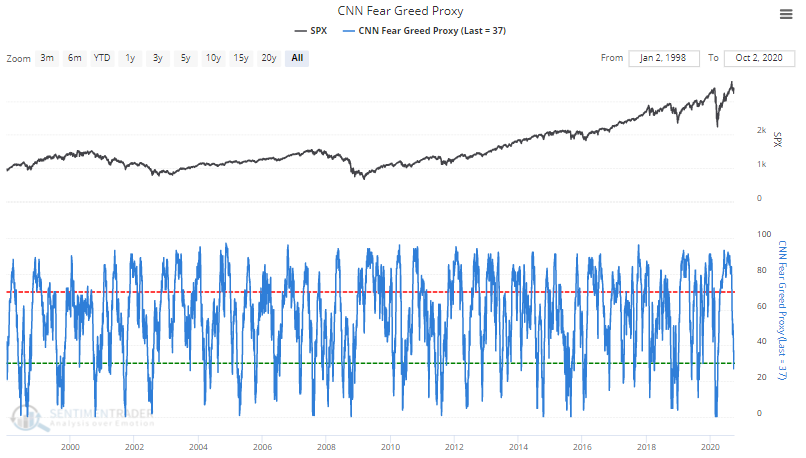
The optimal moving average is 22 days. I.e. go long the S&P 500 when our proxy for the CNN Fear/Greed indicator is above its 22 day moving average, otherwise shift to 100% cash.
- Buy and hold the S&P 500 yields an average of 5.36% per year
- This strategy yields an average of 3.43% per year
Here's the returns chart:
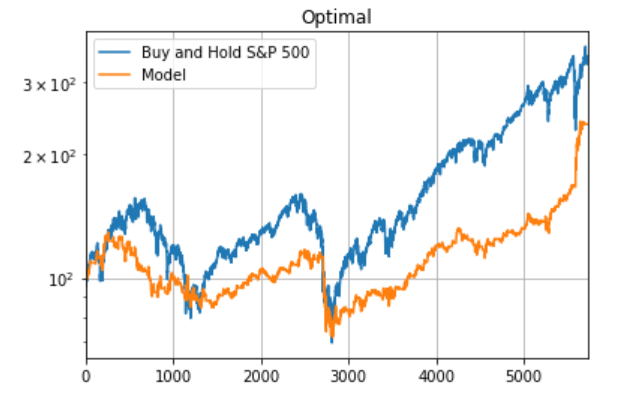
% Showing Excess Optimism-Pessimism Spread
In this simple strategy, go long the S&P 500 when the % Showing Excess Optimism-Pessimism Spread is above a certain moving average ("X"), otherwise shift to 100% cash.
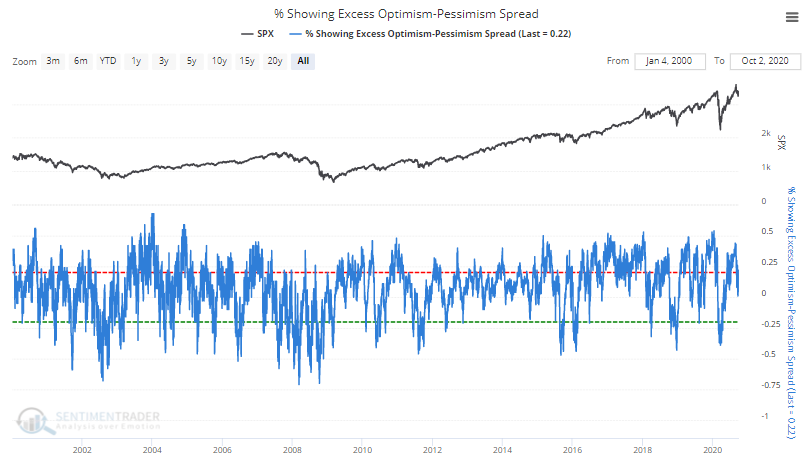
The optimal moving average is 115 days. I.e. go long the S&P 500 when the % Showing Excess Optimism-Pessimism Spread is above its 115 day moving average, otherwise shift to 100% cash.
- Buy and hold the S&P 500 yields and average of 4.51% per year
- This strategy yields an average of 0.7% per year
Here's the returns chart: