Data &
Technology
Research
Reports
Report Solutions
Reports Library
Actionable
Strategies
Free
Resources
Simple Backtest Calculator
Simple Seasonality Calculator
The Kelly Criterion Calculator
Sentiment Geo Map
Public Research Reports
Free Webinar
Pricing
Company
About
Meet Our Team
In the News
Testimonials
Client Success Stories
Contact
Log inLoginSign up
< BACK TO ALL REPORTS

Sentiment cycle is "discouraging"

Jason Goepfert
2020-04-15
If stocks follow a typical Sentiment Cycle, then we've passed the "panic" phase and should be in the midst of months of "discouragement." But we've already seen the signs that are more typically seen at the end of the cycle, not the beginning.

As stocks plunged then recovered at the end of 2018 and start of 2019, we reviewed the typical Sentiment Cycle as popularized by Justin Mamis decades ago.

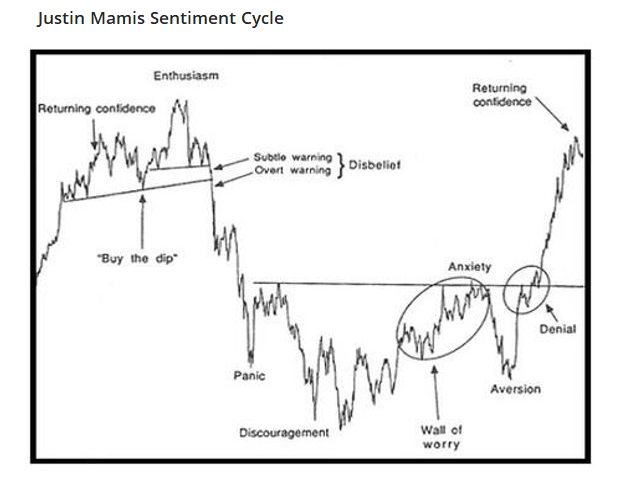
At the time, price action was playing out about in accordance with the typical cycle, but there were good reasons to believe we were further along than the price pattern alone would suggest:

When we used to post this chart daily, the things we noted to watch to watch for when coming out of the Discouragement phase were 1) Explosive price gains over 2-3 day periods, 2) Massive thrusts in market breadth, 3) "Just another bear market rally" articles, and 4) Minimal pullbacks after short-term overbought readings. We can check all 4 of those boxes now, suggesting we’re further along the timeline than price alone would suggest.

That was from early January 2019, and it turns out that we were much further along than price action alone would suggest. There was never any testing of the panic low during what was supposed to be the "discouragement" part of the cycle.

This is notable because we can check most of those boxes now.

1. Explosive price gains over 2-3 day periods? Yes.

2. Massive thrusts in market breadth? Most definitely - by some metrics, the best we've ever seen.

3. "Just another bear market rally" articles? Yes.

4. Minimal pullbacks after short-term overbought readings? Questionable - as Troy mentioned in a premium note, many of our short-term Optix readings for major ETFs are now at extremely high levels.

That last point is debatable, depending on the indicator used. One could make the argument that on very short-term time frames, stocks have already been overbought and yet stocks continued higher until Tuesday, but it's not conclusive. Major bottoms tend to see buyers roll right over any hints of overbought readings.

If we overlay the S&P 500's current path against the typical Sentiment Cycle again, then we get the following. Our current market has been so extreme in just about every regard that we've had to use a secondary scale.

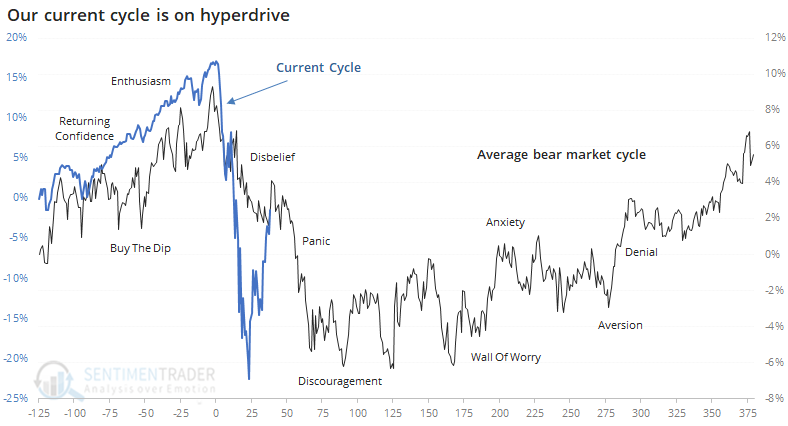
Everything about the past two months has been on a super compressed time frame. What usually takes months or even years to play out has happened in days or weeks, even the slowest-moving aspects of fiscal and monetary responses.

Based on a very general pattern, we should be in the post-panic, discouragement phase of the Cycle. While it doesn't necessarily mean a lower low than the initial panic, it does often mean months of volatile swings that make everyone doubt their outlook.

The biggest problem with this idea is the same as in January 2019. We've already seen the kind of thrusts and behavior that we see during the latter part of the Sentiment Cycle, not the beginning, so we'd place less weight on the idea of a typical cycle than normal. If anything, given behavior over the past two weeks, the current juncture is more like "anxiety" than "discouragement."

Sorry, you don't have access to this report

Upgrade your subscription plan to get access
Go to Dasboard
DATA &
TECHnologies
IndicatorEdge
‍
BackTestEdge
‍
Other Tools
‍
DataEdge API
RESEARCH
reports
Research Solution
‍
Reports Library
‍
actionable
Strategies
Trading Strategies
‍
Smart Stock Scanner
‍
FREE
RESOUrCES
Simple Backtest
Calculator
Simple Seasonality
Calculator
The Kelly Criterion
Calculator
Sentiment Geo Map
‍
Public Research Reports
‍
Free Webinar
COMPANY
‍
About
‍
Meet our Team
‍
In the News
‍
Testimonials
‍
Client Success Stories
Pricing
Bundle pricing
‍
Announcements
‍
FAQ
© 2024 Sundial Capital Research Inc. All rights reserved.
Setsail Marketing
TermsPrivacyAffiliate Program
Risk Disclosure: Futures and forex trading contains substantial risk and is not for every investor. An investor could potentially lose all or more than the initial investment. Risk capital is money that can be lost without jeopardizing ones’ financial security or life style. Only risk capital should be used for trading and only those with sufficient risk capital should consider trading. Past performance is not necessarily indicative of future results.

Hypothetical Performance Disclosure: Hypothetical performance results have many inherent limitations, some of which are described below. No representation is being made that any account will or is likely to achieve profits or losses similar to those shown; in fact, there are frequently sharp differences between hypothetical performance results and the actual results subsequently achieved by any particular trading program. One of the limitations of hypothetical performance results is that they are generally prepared with the benefit of hindsight. In addition, hypothetical trading does not involve financial risk, and no hypothetical trading record can completely account for the impact of financial risk of actual trading. for example, the ability to withstand losses or to adhere to a particular trading program in spite of trading losses are material points which can also adversely affect actual trading results. There are numerous other factors related to the markets in general or to the implementation of any specific trading program which cannot be fully accounted for in the preparation of hypothetical performance results and all which can adversely affect trading results.

Testimonial Disclosure: Testimonials appearing on this website may not be representative of other clients or customers and is not a guarantee of future performance or success.