
Semiconductor stocks trigger a bullish price pattern

Key points:
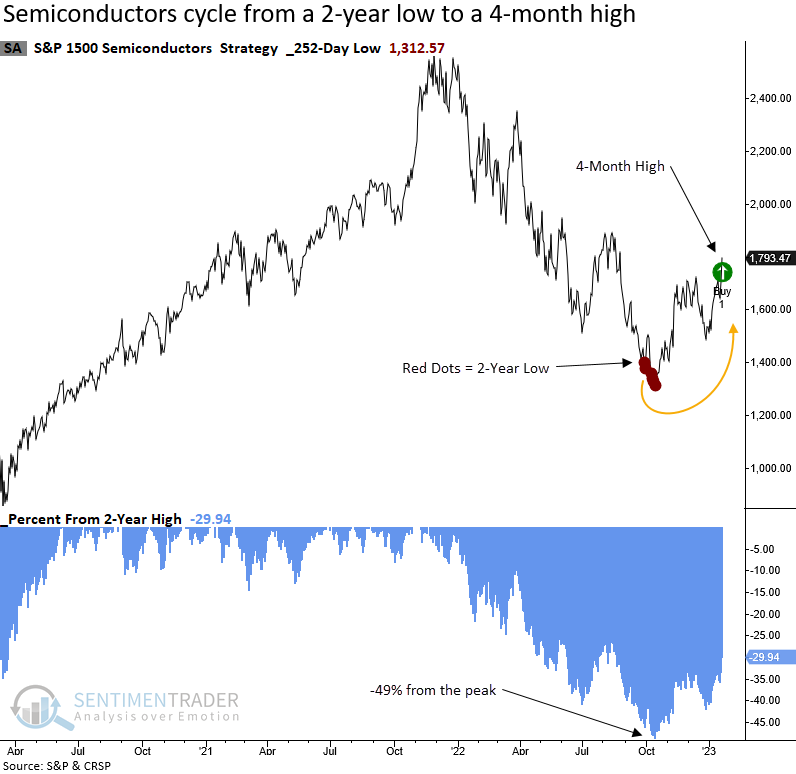
- The S&P 1500 semiconductor sub-industry group cycled from a 2-year low to a 4-month high
- After similar recoveries, the reward was huge but so was the risk in some cases
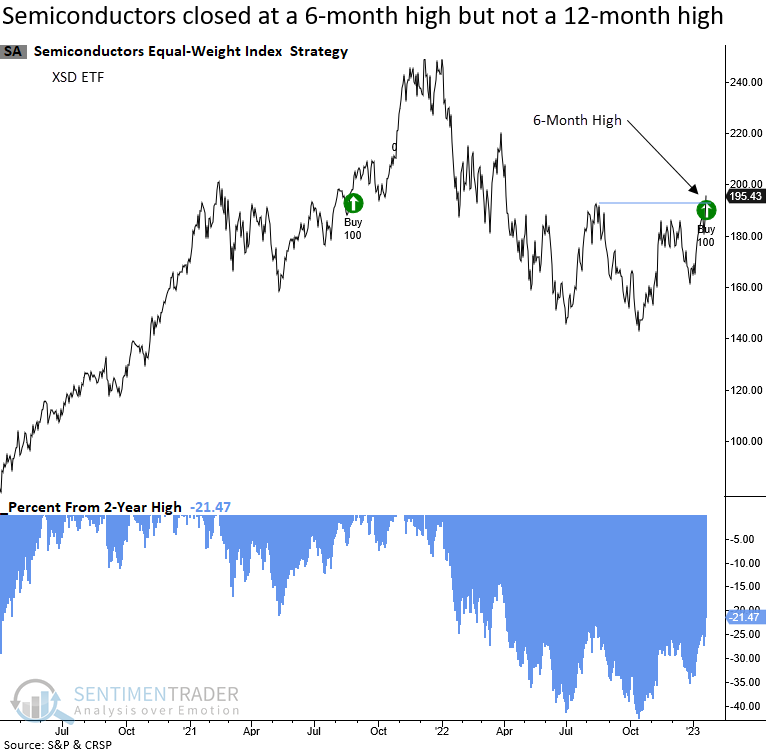
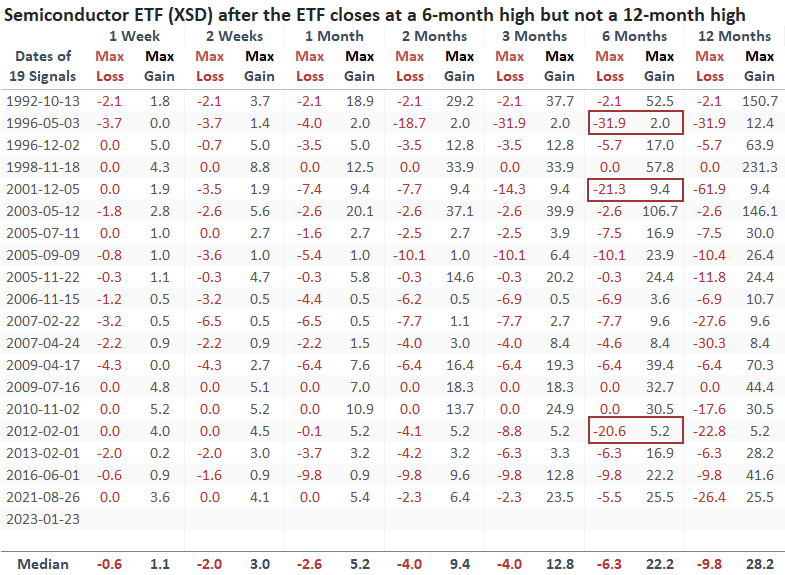
- An equal-weighted Semiconductor ETF closed at a new 6-month high but not a 12-month high
- After similar breakouts, the ETF was higher 84% of the time six months later
A growth-oriented cyclical industry recovers from a multi-year low
On Monday, the S&P 1500 Semiconductor sub-industry group closed at a 4-month high. The new high represents the first instance after a 2-year low and a brutal 49% drawdown. While the recovery in the capitalization-weighted semiconductor industry is a bullish development, the equal-weighted Semiconductor ETF (XSD) looks even more impressive as it closed at a 6-month high.
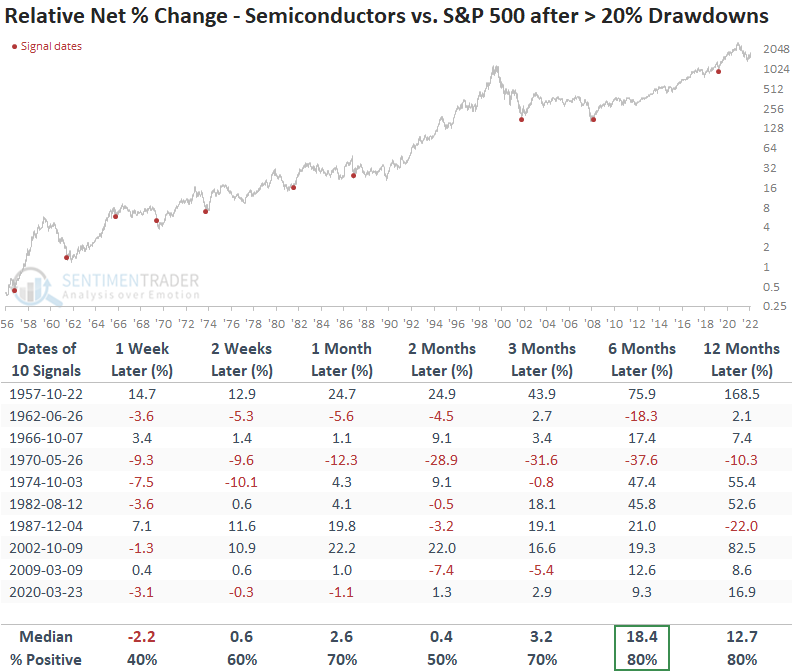
Semiconductors are a crucial industry to monitor around bear market lows as the group maintains an outstanding track record of outperforming the S&P 500 after significant drawdowns.
So, with a potential bear market bottom in play, let's assess the outlook for the Semiconductor industry under similar conditions.
Similar recoveries preceded bullish long-term performance results
When the S&P 1500 Semiconductor group cycles from a 2-year low to a 4-month high, the industry tends to perform well on a long-term basis, especially six months later. The recovery in semiconductor stocks typically foreshadows an end to bear markets, with two notable exceptions occurring in 2002 and 2008. 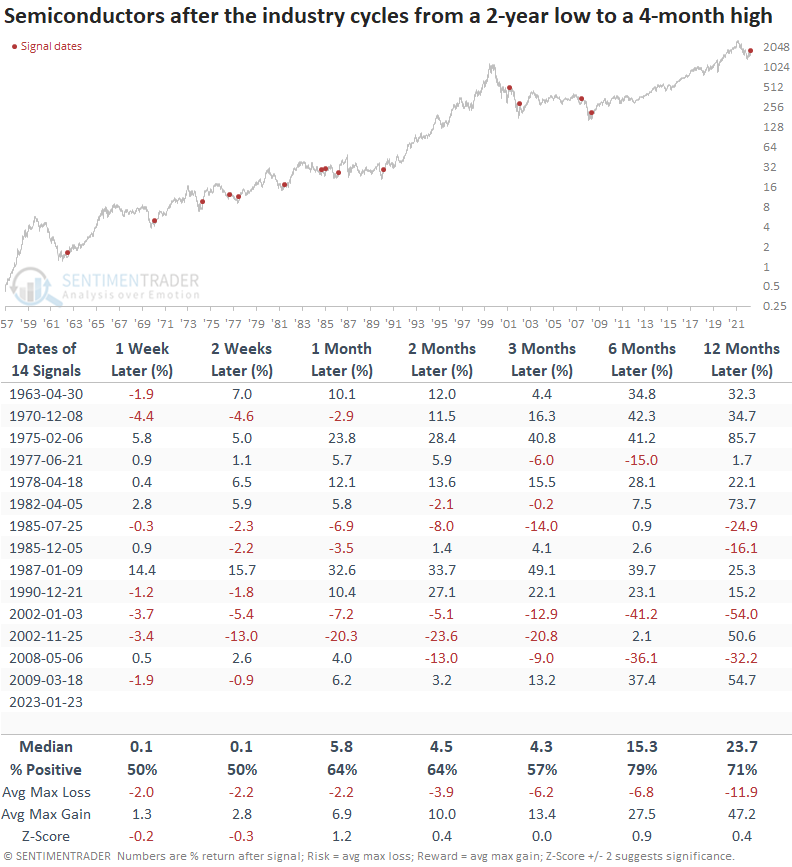
Semiconductor stocks are a high-octane group. With great reward comes significant risk in a handful of cases.

A bullish base breakout for Semiconductor stocks
The equal-weighted Semiconductor ETF (XSD) closed at a 6-month high, exceeding the previous peak from August 2022, which differs from the capitalization-weighted version as it remains below its August pivot point.
So, price trends for the average Semiconductor stock look more bullish than what a capitalization-weighted index might indicate.
When the equal-weighted Semiconductor ETF (XSD) closes at a 6-month high but not a 12-month, the breakout typically leads to further gains after the ETF digests the bullish price action leading up to the signal. Six months later, the ETF was higher 84% of the time.
I extended the limited history for the XSD ETF using an equal-weighted basket of semiconductor stocks from CRSP.
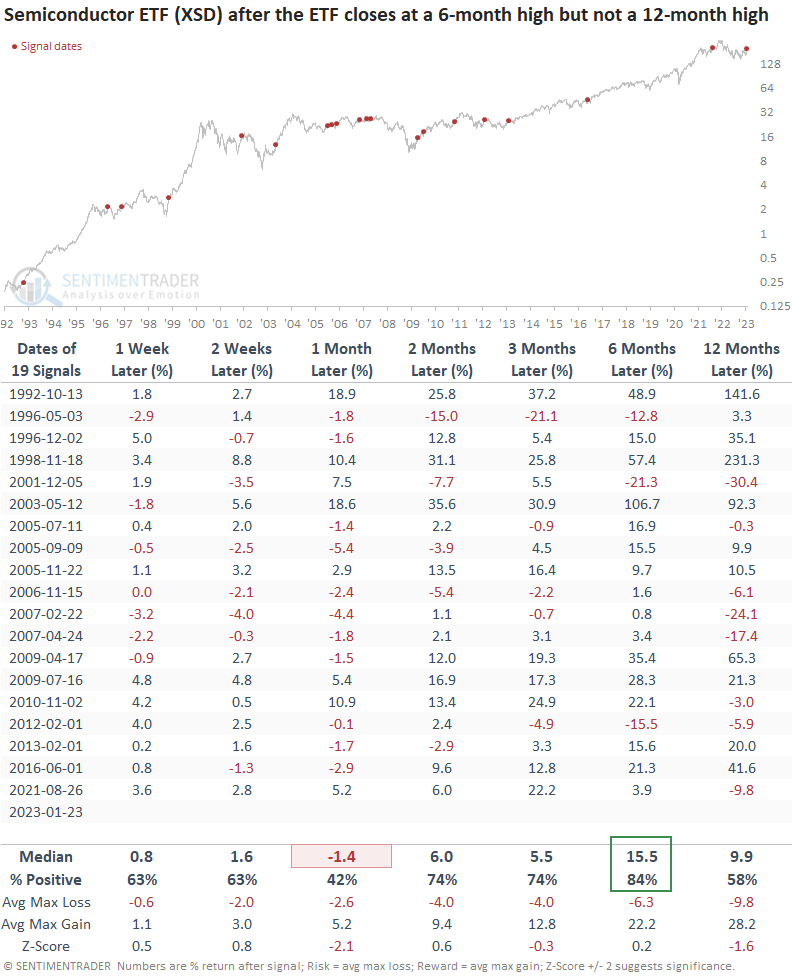
The max gain to max loss profile looks solid except for three instances. Unfortunately, whipsaw signals in the 2000-02 period continue to pop up in studies.
Mind the opportunity in Semiconductor stocks
Semiconductor stocks maintain an excellent long-term track record of outperforming the S&P 500 after significant drawdowns, with an 80% win rate six and twelve months later.
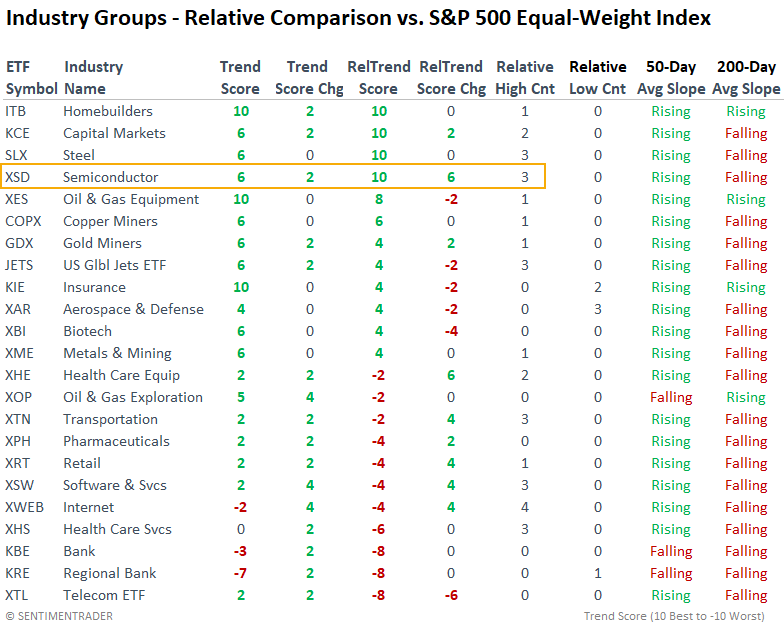
Suppose the broad market is in the process of forming a bottom. In that case, the perfect (+10) relative trend score for the Semiconductor ETF (XSD) bodes well for the group, as Semiconductors could once again outperform the S&P 500 after a significant drawdown.
What the research tells us...
The S&P 1500 Semiconductor sub-industry group cycled from a 2-year low to a 4-month high, triggering a bullish price pattern for a growth-oriented cyclical industry. After similar signals, the Semiconductor industry rose 79% of the time over the next six months. And an equal-weighted index of Semiconductor stocks closed at a 6-month high but not a 12-month high. The base breakout pattern for the equal-weighted index suggests price trends for the average semiconductor stock are recovering even more impressively, which has led to positive results 84% of the time over the next six months. While one cannot rule out a whipsaw signal, similar to the 2000-02 bear market, the recovery in semiconductor stocks adds another checkmark to the bullish side of the ledger.