
Semiconductor Divergence

Semiconductors have been in the news of late. Even the long-running television news magazine show 60 Minutes discussed the chip shortage in a recent feature. By now, I'm sure you have read or heard someone imply that semiconductors are the new copper, given their growing utilization in everyday products. Even yesterday, I listened to another market commentator suggest that semiconductors are a bellwether group, and one should pay attention when they diverge from the broad market.
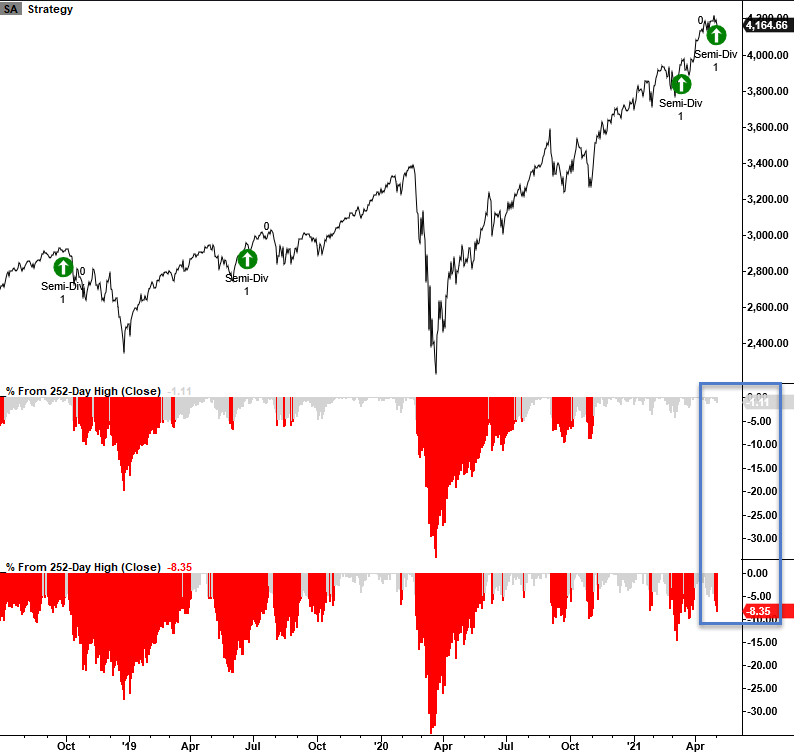
With semiconductors down 8.35% as the S&P 500 is down 1.11% from their respective highs, let's see if the divergence for the new bellwether group spells doom and gloom for the broad market.
DIVERGENCE ANALYSIS
Coding a divergence scenario can be a challenging task. More often than not, one has to add several other conditions to find similarities, and even then, it's not perfect. I will use the conditions from Monday when semiconductors were down 7% as the S&P 500 was down less than 1%. In addition to the percent from high parameters, I included a condition that requires the S&P 500 to be within five days of a 252-day high. Lastly, I screened out repeats by using a 1-month holding period.
Let's take a look at some charts and the historical signal performance.
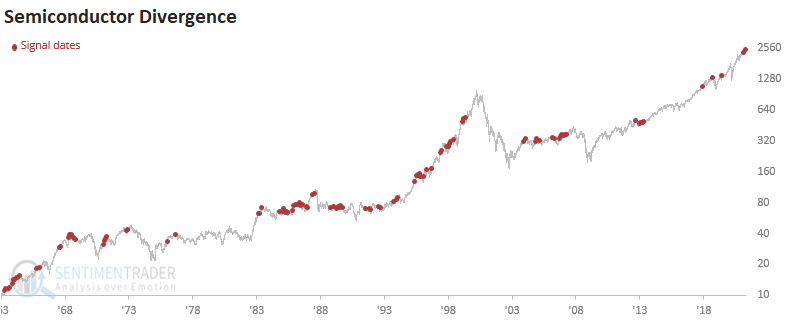
Current Chart
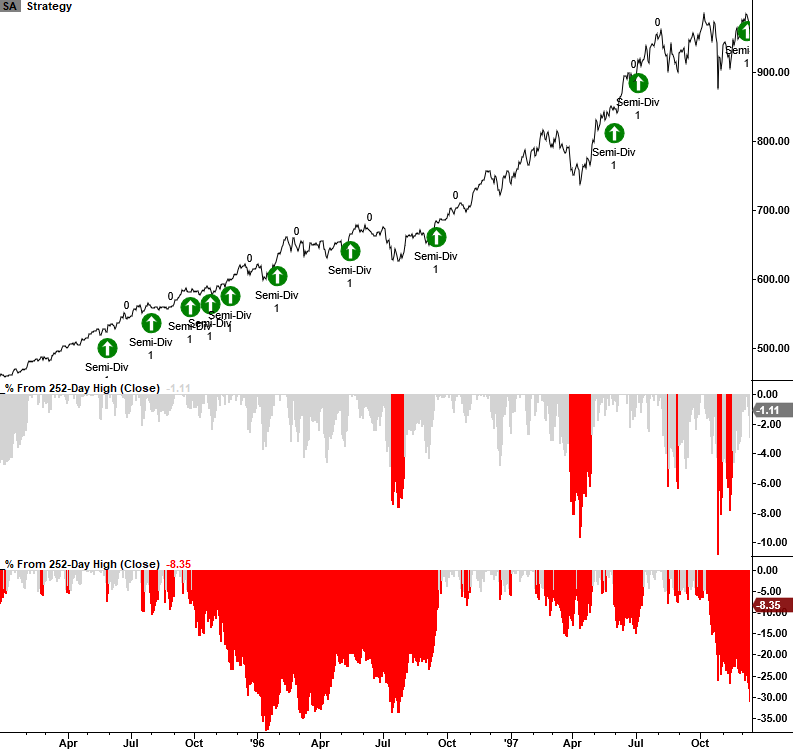
1995-97 CHART
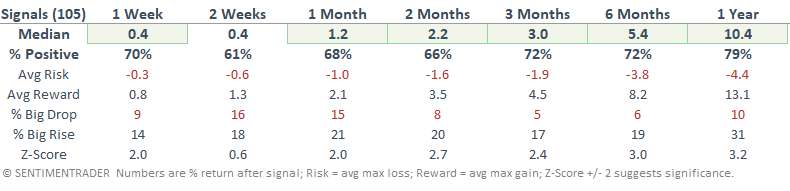
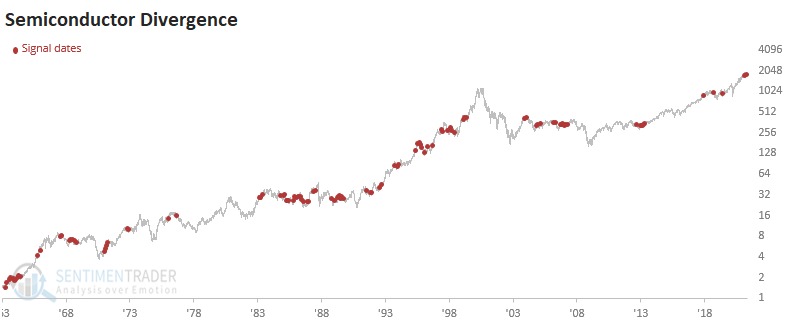
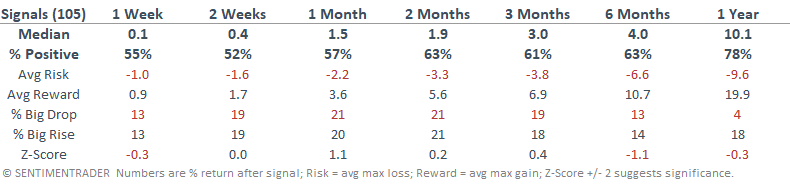
HOW DID THE SIGNAL PERFORM - S&P 500 RETURNS
It would appear that a divergence between semiconductors and the S&P 500 did not hurt forward returns for the broad market. Returns look good across all timeframes. I would note that most signals occurred between 1983 and 2000, a strong bull market period. With fewer divergence signals in the last few decades, one could imply that the semiconductor cycles are less volatile as utilization is widespread across several industry groups.
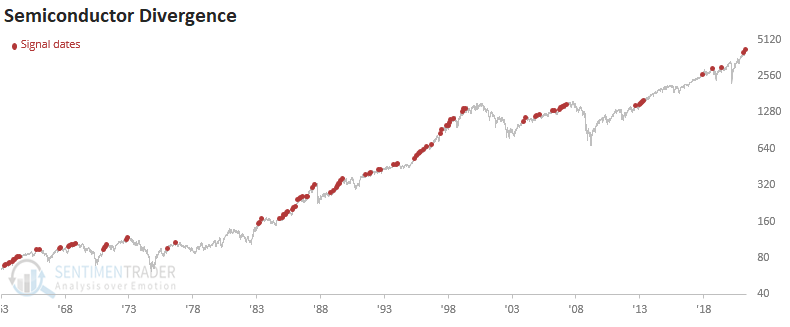
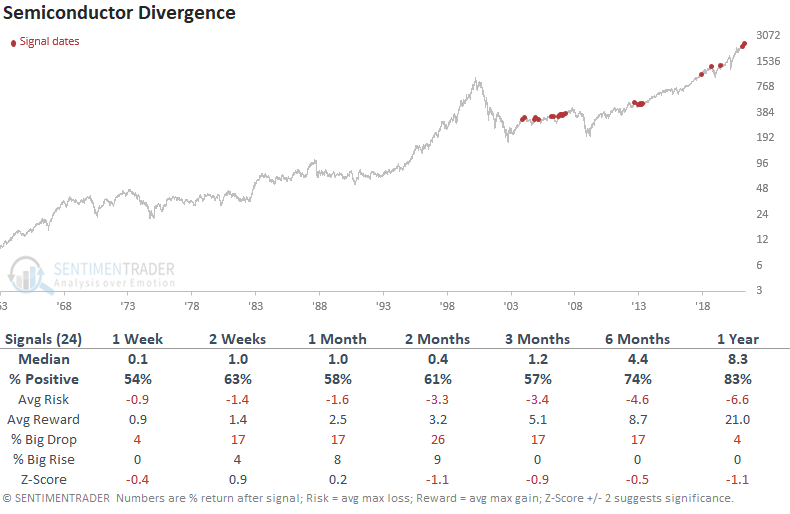
Let's take a look at the signals following the 2000 bubble peak.
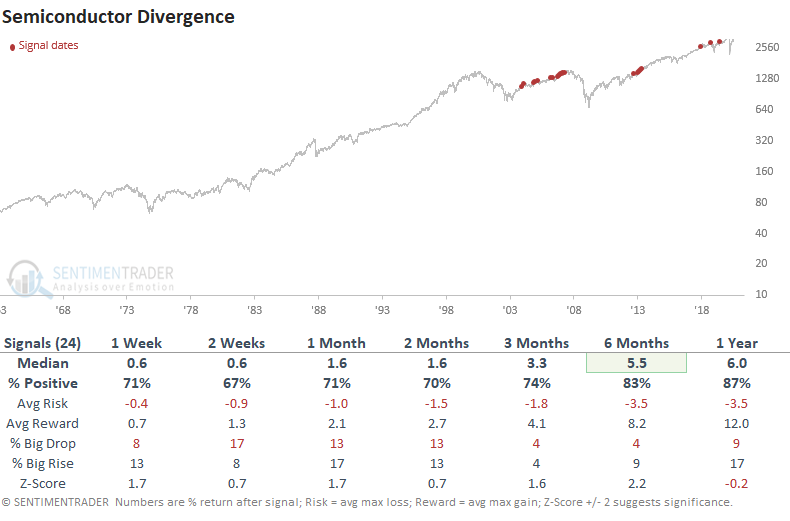
HOW DID THE SIGNAL PERFORM - S&P 500 RETURNS - SIGNALS AFTER 2000
Broad market returns still look good.
HOW DID THE SIGNAL PERFORM - SEMICONDUCTOR RETURNS
Signal performance looks weak in the 1-2 week timeframe and just okay in the other periods.
Let's take a look at the signals following the 2000 bubble peak.
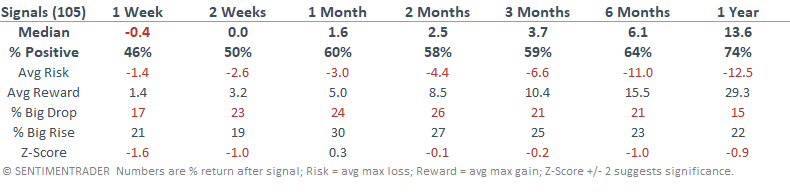
HOW DID THE SIGNAL PERFORM - SEMICONDUCTOR RETURNS - SIGNALS AFTER 2000
Signal performance looks a little worse in the post-2000 period.
Let's see if the weak to mixed results in semiconductors impacted the broader technology group.
HOW DID THE SIGNAL PERFORM - TECHNOLOGY RETURNS
Results look mixed to slightly soft.
Let's take a look at the signals following the 2000 bubble peak.
HOW DID THE SIGNAL PERFORM - TECHNOLOGY RETURNS -SIGNALS AFTER 2000
Once again, the performance looks mixed to slightly weak.
While it may be fun to label a group as a bellwether and make bullish or bearish predictions based on the latest pattern, I always like to let the data do the talking. The current divergence between semiconductors and the S&P 500 does not spell doom and gloom for the broad market based on history.