
Semiconductor Consistency

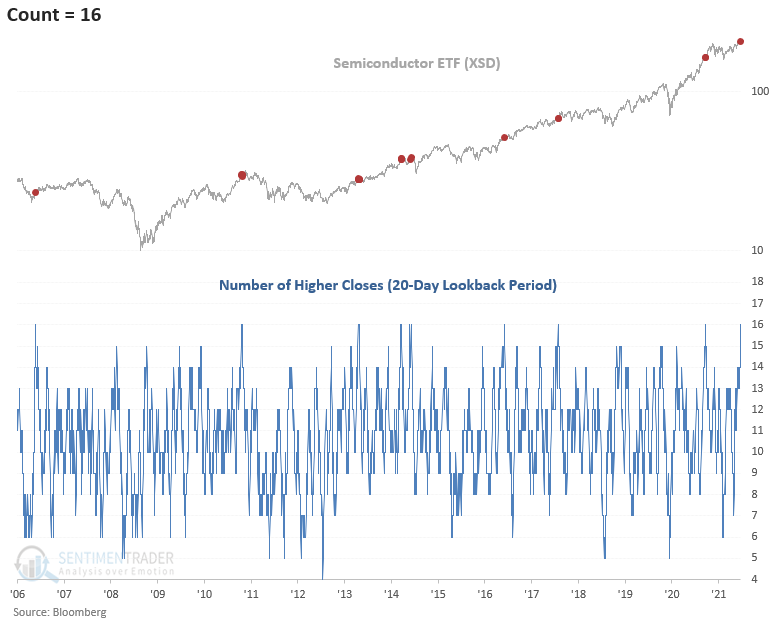
The Semiconductor ETF (XSD) has now closed higher in 16 of the last 20 sessions. We often read or hear someone imply that semiconductors are the new copper, given their growing utilization in everyday products. In a note on 5/5/21, I showed that when semiconductors lagged the broad market, it didn't spell doom and gloom for the S&P 500. With semiconductors consistently registering higher closes over a rolling 1-month period, let's see if the strong momentum implies a brighter outlook for the group and the broad market.
Let's conduct a study to assess the forward return outlook for semiconductors and the broad market when the group closes higher in 16 out of 20 trading sessions.
HISTORICAL CHART
I like the semiconductor ETF (XSD) because it uses an equal-weighted index methodology versus a cap-weighted one for member representation. i.e., each member has the same weight and influence on returns.
An equal-weighting methodology provides a better assessment of industry trends. In contrast, a cap-weighted version can be influenced by a few bellwethers.
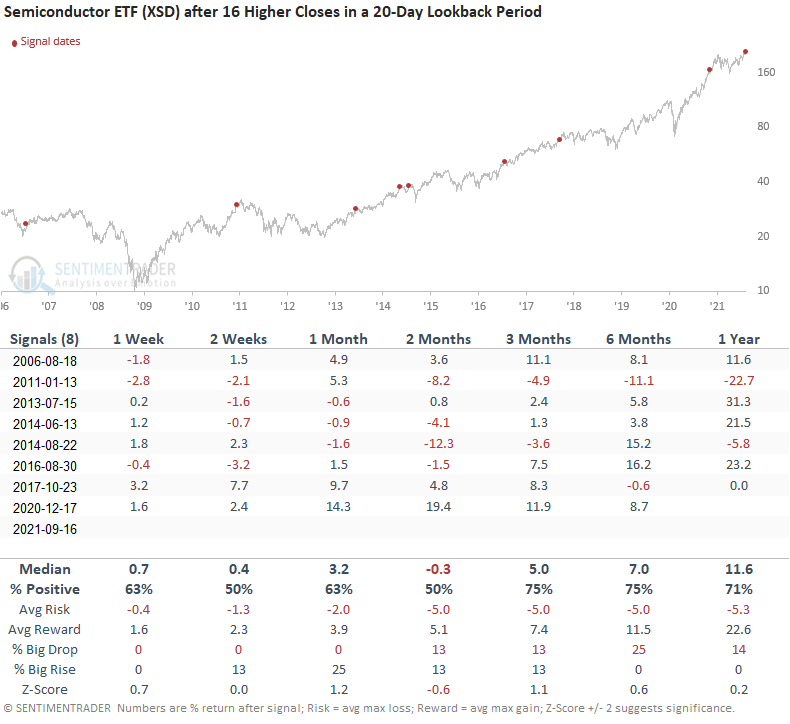
HOW THE SIGNALS PERFORMED
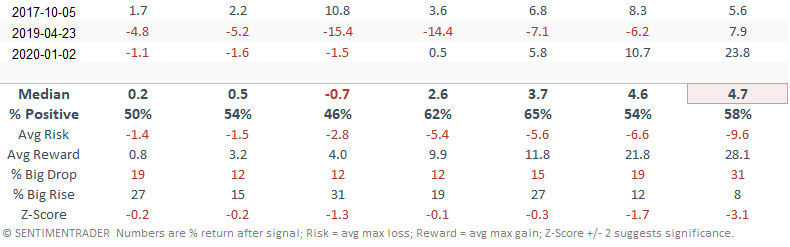
While the sample size is small, performance looks somewhat mixed in the short-term with slightly better results post the 2-month window.
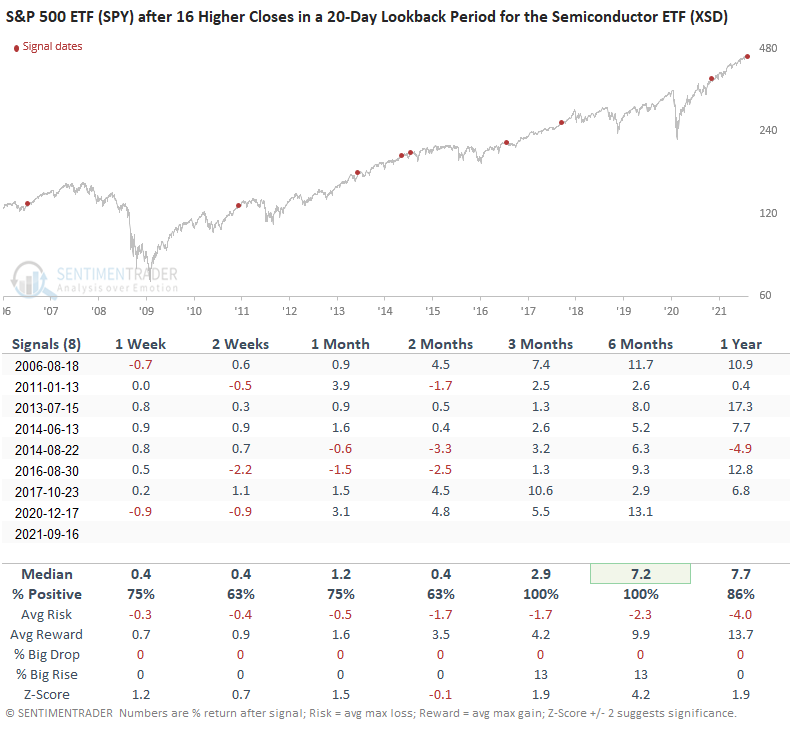
HOW THE SIGNALS PERFORMED - SPY ETF
Results for the S&P 500 ETF look good across all timeframes, especially the 6-month window. It would appear that consistently higher closes for the semiconductor group are beneficial for the broad market.
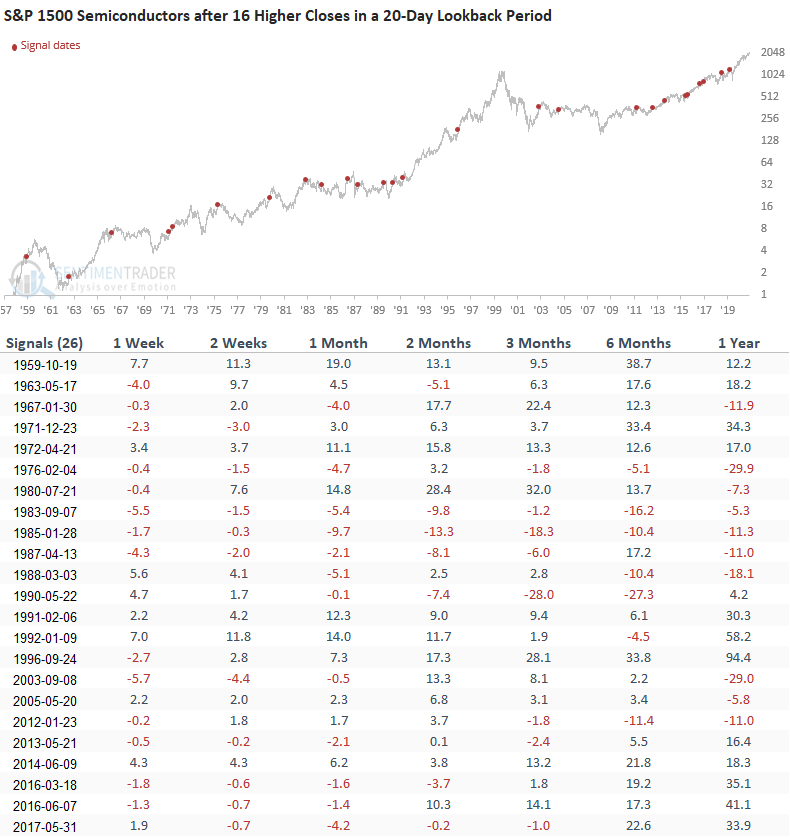
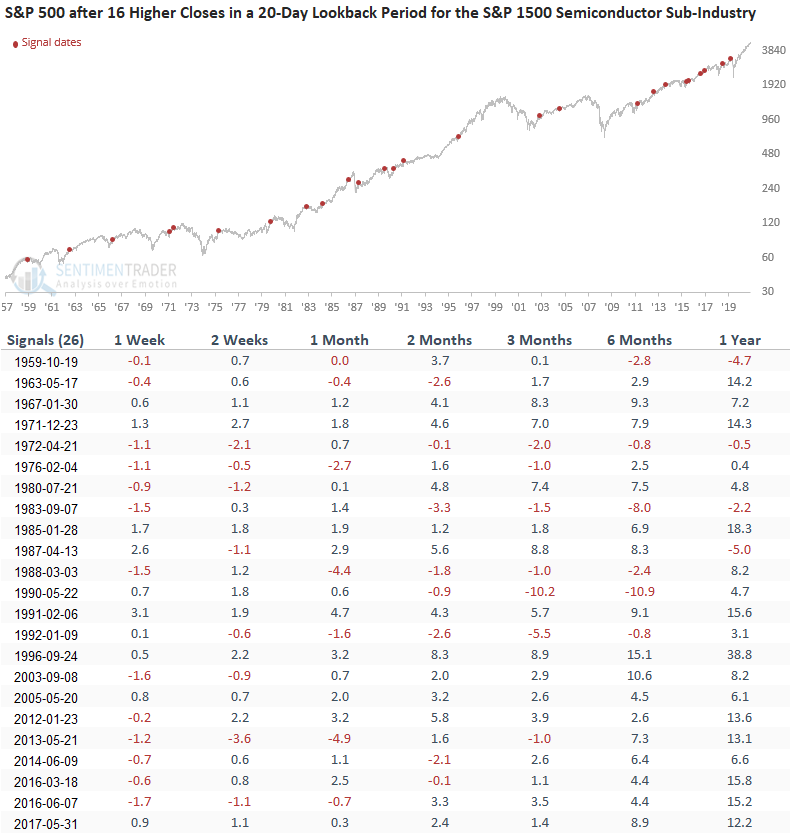
Let's switch our analysis to the S&P 1500 Semiconductor Sub-Industry Group to assess a larger sample size.
The semiconductor sub-industry group is cap-weighted. So, the analysis could be skewed by a handful of issues versus a pure industry trend.
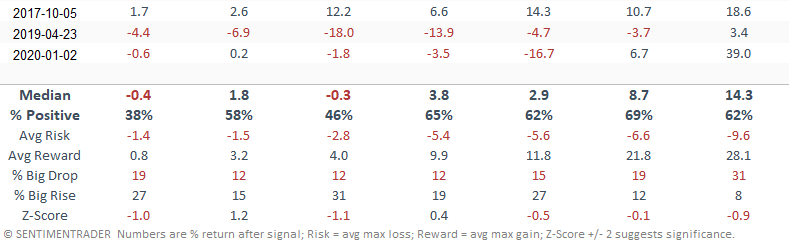
HOW THE SIGNALS PERFORMED
Results look mixed to slightly weak in the short term. It would appear that after a high level of consistently higher closes, the group takes a break. The intermediate to long-term results look in line with historical averages.
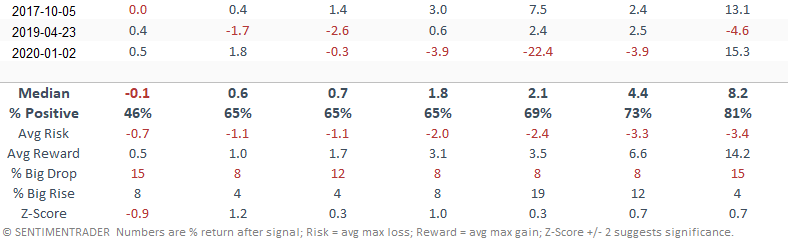
HOW THE SIGNALS PERFORMED
The win rate for the S&P 500 looks better, especially in the short term. The intermediate to long-term performance looks in line to better with historical averages. I would note that the 1-year has registered 15/16 positive returns since 1988.
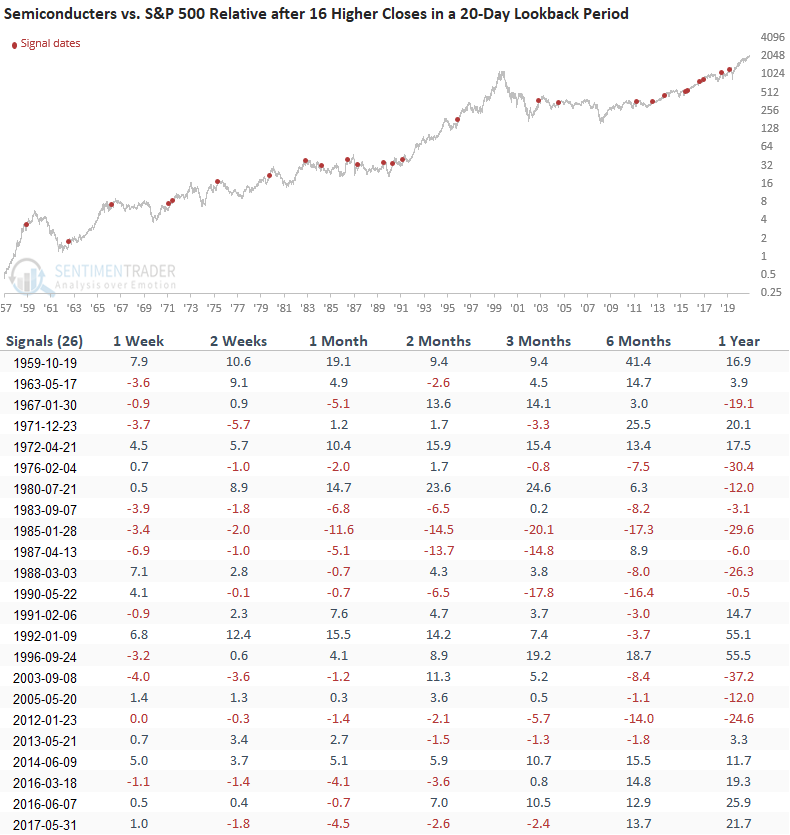
HOW THE SIGNALS PERFORMED - RELATIVE RATIO COMPARISON
If we compare semiconductors to the S&P 500, we see uninspiring results across most timeframes. However, the win rate looks okay in the 2-3 month window.
Today's study is somewhat inconclusive. If we look at the equal-weighted semiconductor ETF, the broad market message looks promising. However, we see a less than stellar market message when we assess more historical instances via the cap-weight semiconductor sub-industry group. As always, data and statistics tell the real story.