
Selling pressure in investment-grade bonds hits 17-year extreme

Key points:
- Breadth measures show that selling in investment-grade bonds is the worst in at least 17 years
- This week, nearly 70% of bonds fell to a 52-week low
- Investment-grade bonds have also underperformed high-yield, with the ratio between the two at a record low
- There is a knee-jerk contrarian urge to assume this is a buying opportunity, but it's not that clear
A 17-year extreme in investment-grade bond selling
The biggest story in markets is the complete and utter devastation in the bond market. A market like this, a primary source of leverage, doesn't make moves like this without wiping out some major players. It just hasn't been reported yet.
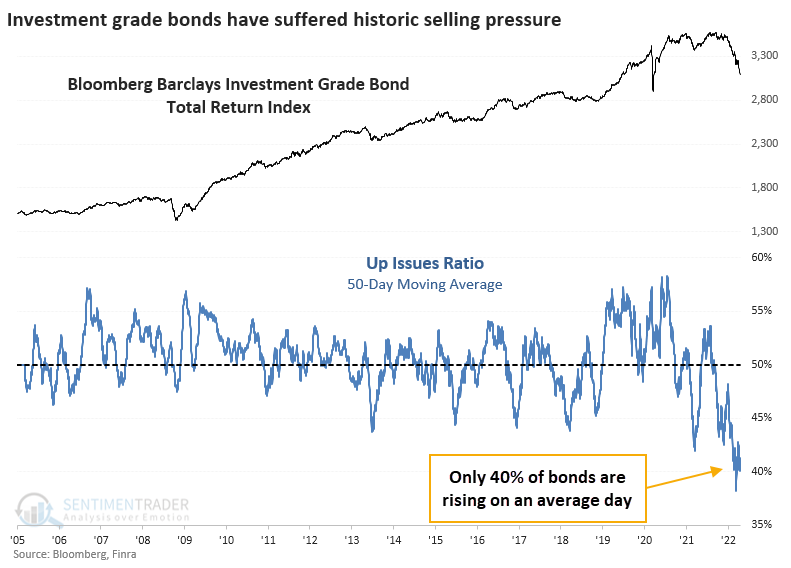
The selling in investment-grade bonds is particularly severe. While often assumed to be one of the safest parts of the bond market, it has been anything but. Over the past 50 sessions, only about 40% of bonds have increased in price on an average day. We've never seen anything like this in at least 17 years.
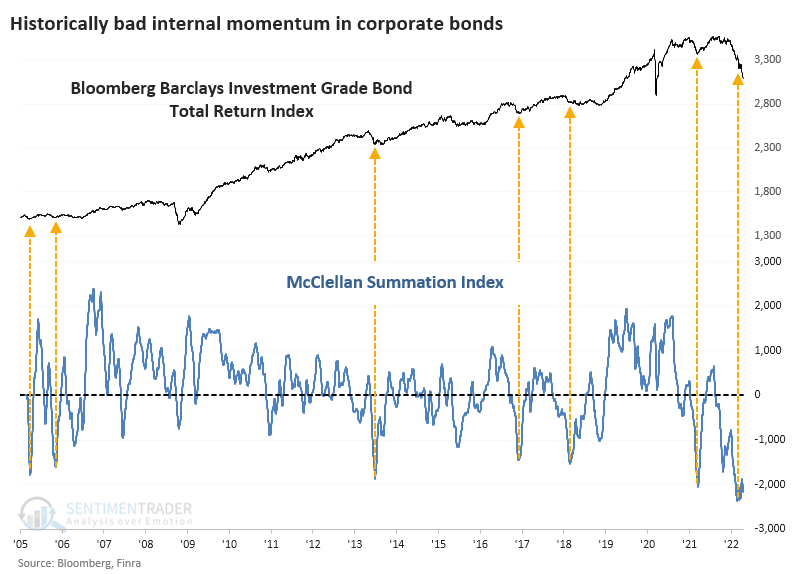
The incessant selling pressure has pushed the McClellan Summation Index for this market to a record low.
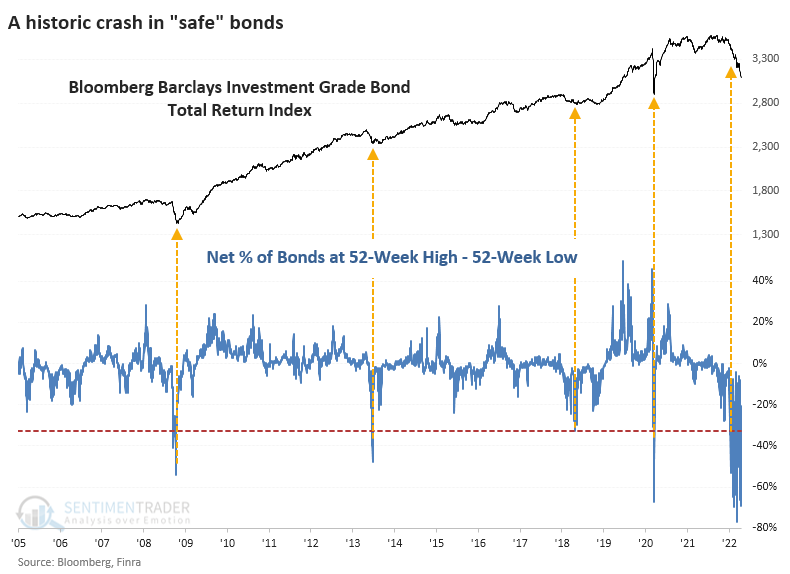
Since February, there have been seven days, including Tuesday, when more than 60% of bonds traded at a 52-week low. This is an astounding figure beyond anything the current generation of investors has seen. It's worse than the financial crisis, worse than the taper tantrum, and worse than the pandemic.
Even junk bonds have performed better
Selling has been prevalent in the high-yield corporate bond market, too. We saw that as early as February when many breadth metrics were hitting multi-year or multi-decade extremes.
Even though those bonds continued to sell off into March and are struggling to hold their lows, they're still outperforming investment-grade bonds. This is curious because investors tend to dump junk bonds and head into investment-grade ones as a relatively safe haven when they panic.
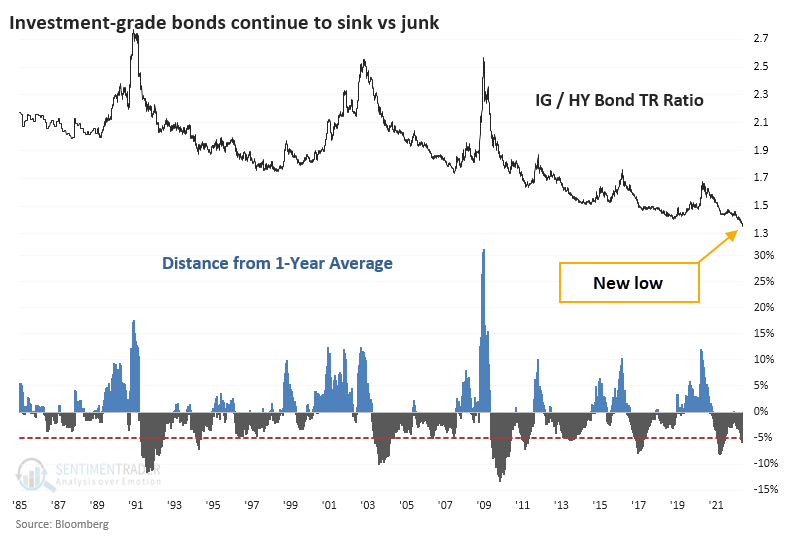
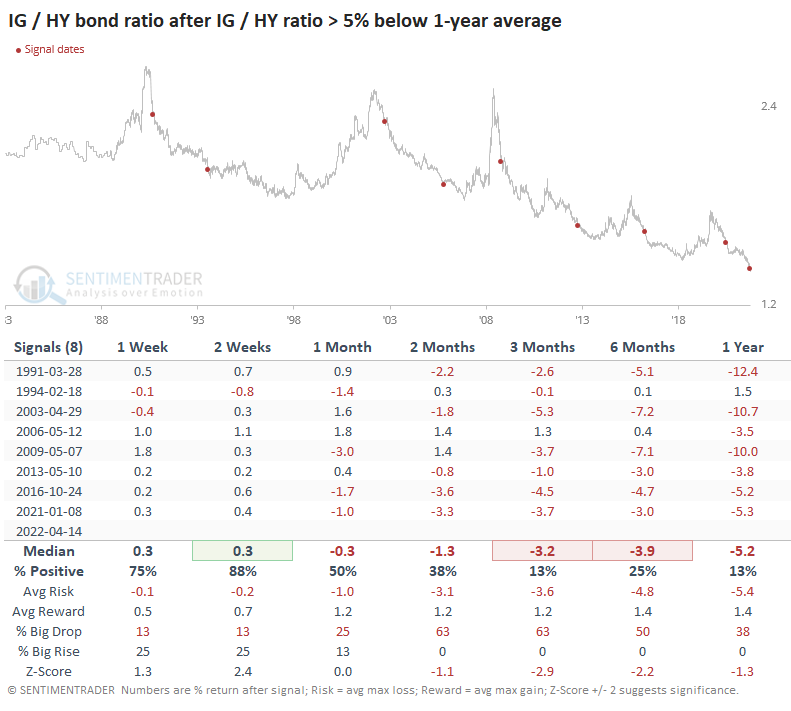
We're seeing the opposite of that, with an all-time low in the ratio between the Bloomberg Barclays total return on investment-grade and high-yield bonds. The ratio has just dropped more than 5% below its one-year average.
Historically, this has not meant that investors should tilt their exposure back to investment-grade (IG) over high-yield (HY). While the next couple of weeks saw some mean-reversion, high-yield bonds typically outperformed over the next 2-6 months.
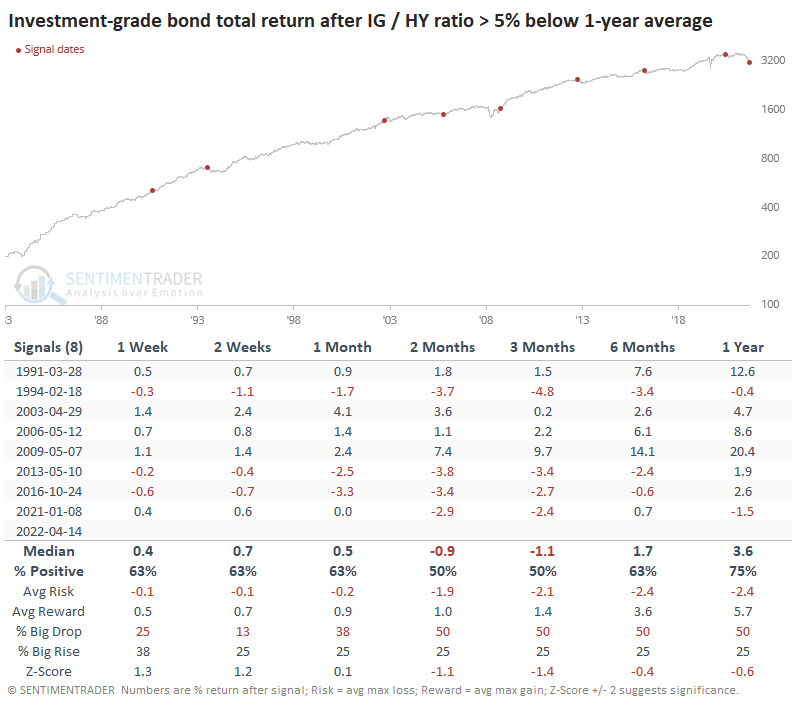
Looking at the total return in investment-grade bonds after those signals, there was a soft spot in the medium-term, but the index did tend to rise longer-term. Of course, there has been a 40-year bond bull market, so that helps.
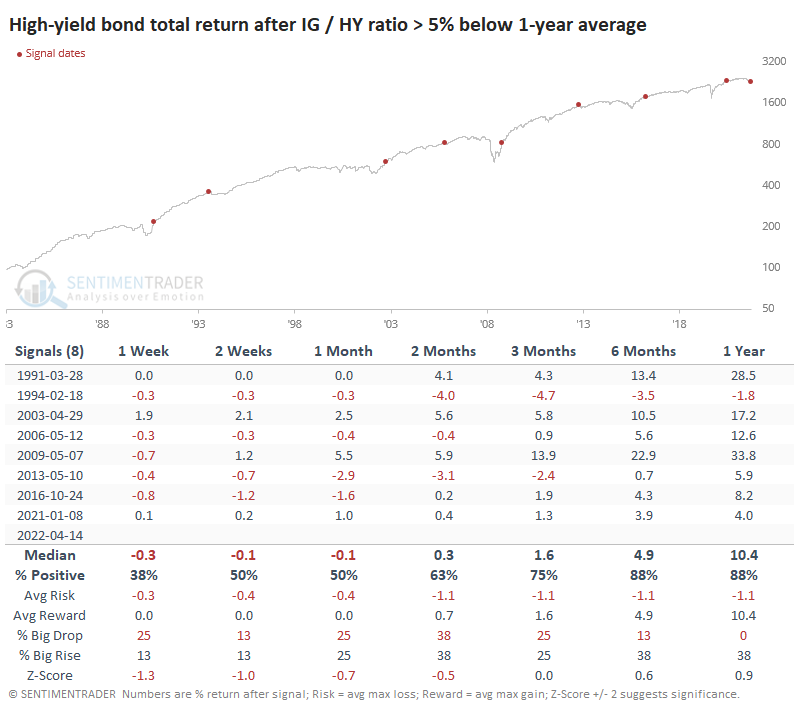
The soft spot occurred sooner for high-yield bonds, and medium- to long-term returns were better.
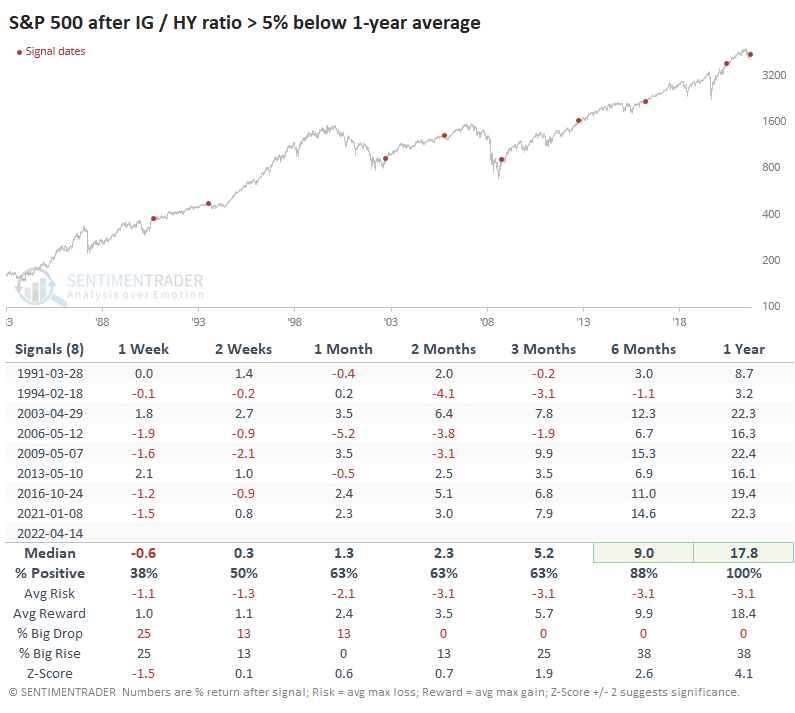
These signals didn't mean much up to several months later for the stock market, but the S&P 500's long-term returns were better than random, with no losses of any significance over the next 6-12 months.
What the research tells us...
One of the most challenging aspects of the last several months is the inability of investors to lift markets after pessimistic extremes. Nowhere is that more evident than in the bond market, where we're seeing activity that two generations of investors don't know how to handle. Bonds are simply not responding how they have in at least 30 years. It has many hallmarks of forced selling pressure, and trying to guess when that might end is a fool's errand without some inside information. Based purely on the level of selling pressure in corporate (and Treasury) bonds, it now appears to be an excellent risk/reward setup for buyers. The trouble is that that was the case two months ago, too, and yet here we are. With activity like this, buys are typically best left for people who dollar-cost average or wait for the selling pressure to end and the market to recover to a more healthy environment. There is no sign of that yet.