
Selling pressure in consumer staples is getting spiky

Key points:
- Consumer staples stocks have been the focus of some of the worst selling pressure in recent weeks
- A handful of indicators that tend to get "spiky" during panics have triggered extreme readings
- After other days when there was a confluence of spiky oversold readings, the XLP fund consistently rebounded
A bevy of indicators show "spiky" selling pressure
While major indexes (other than the small-cap Russell 2000) have held up relatively well in recent weeks, select pockets have not. One of those is the consumer staples sector.
Over the past month, only 3 of the 38 components of the S&P 500 consumer staples sector have rallied, and 9 of those stocks have lost double-digits, led by losses in stocks like Constellation Brands, Brown Forman, Hershey, and General Mills.
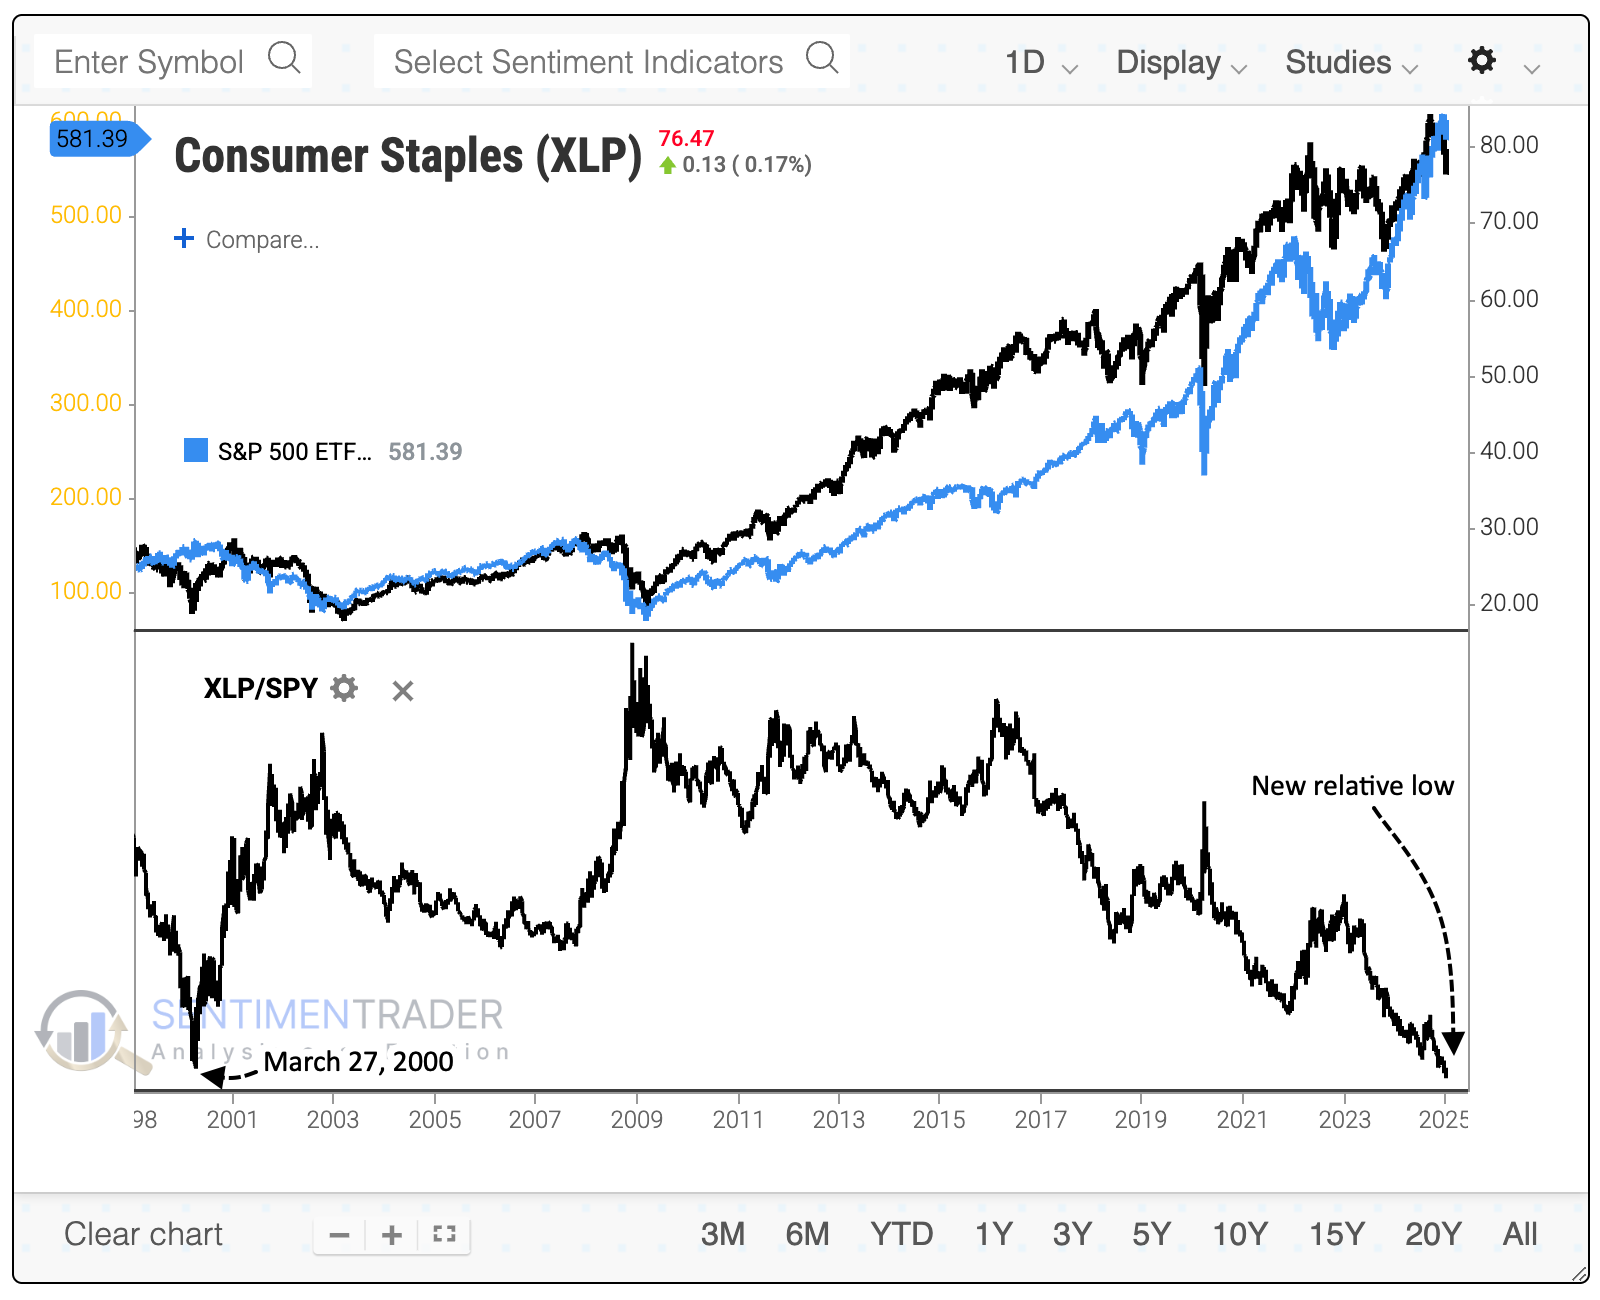
These losses are disturbing for investors who might have gravitated to defensive sectors, assuming they'd hold up better if stocks were heading into a correction. Instead, the ratio between XLP (SPDR Consumer Staples) and SPY recently hit a record low, exceeding the prior low from March 27, 2000.
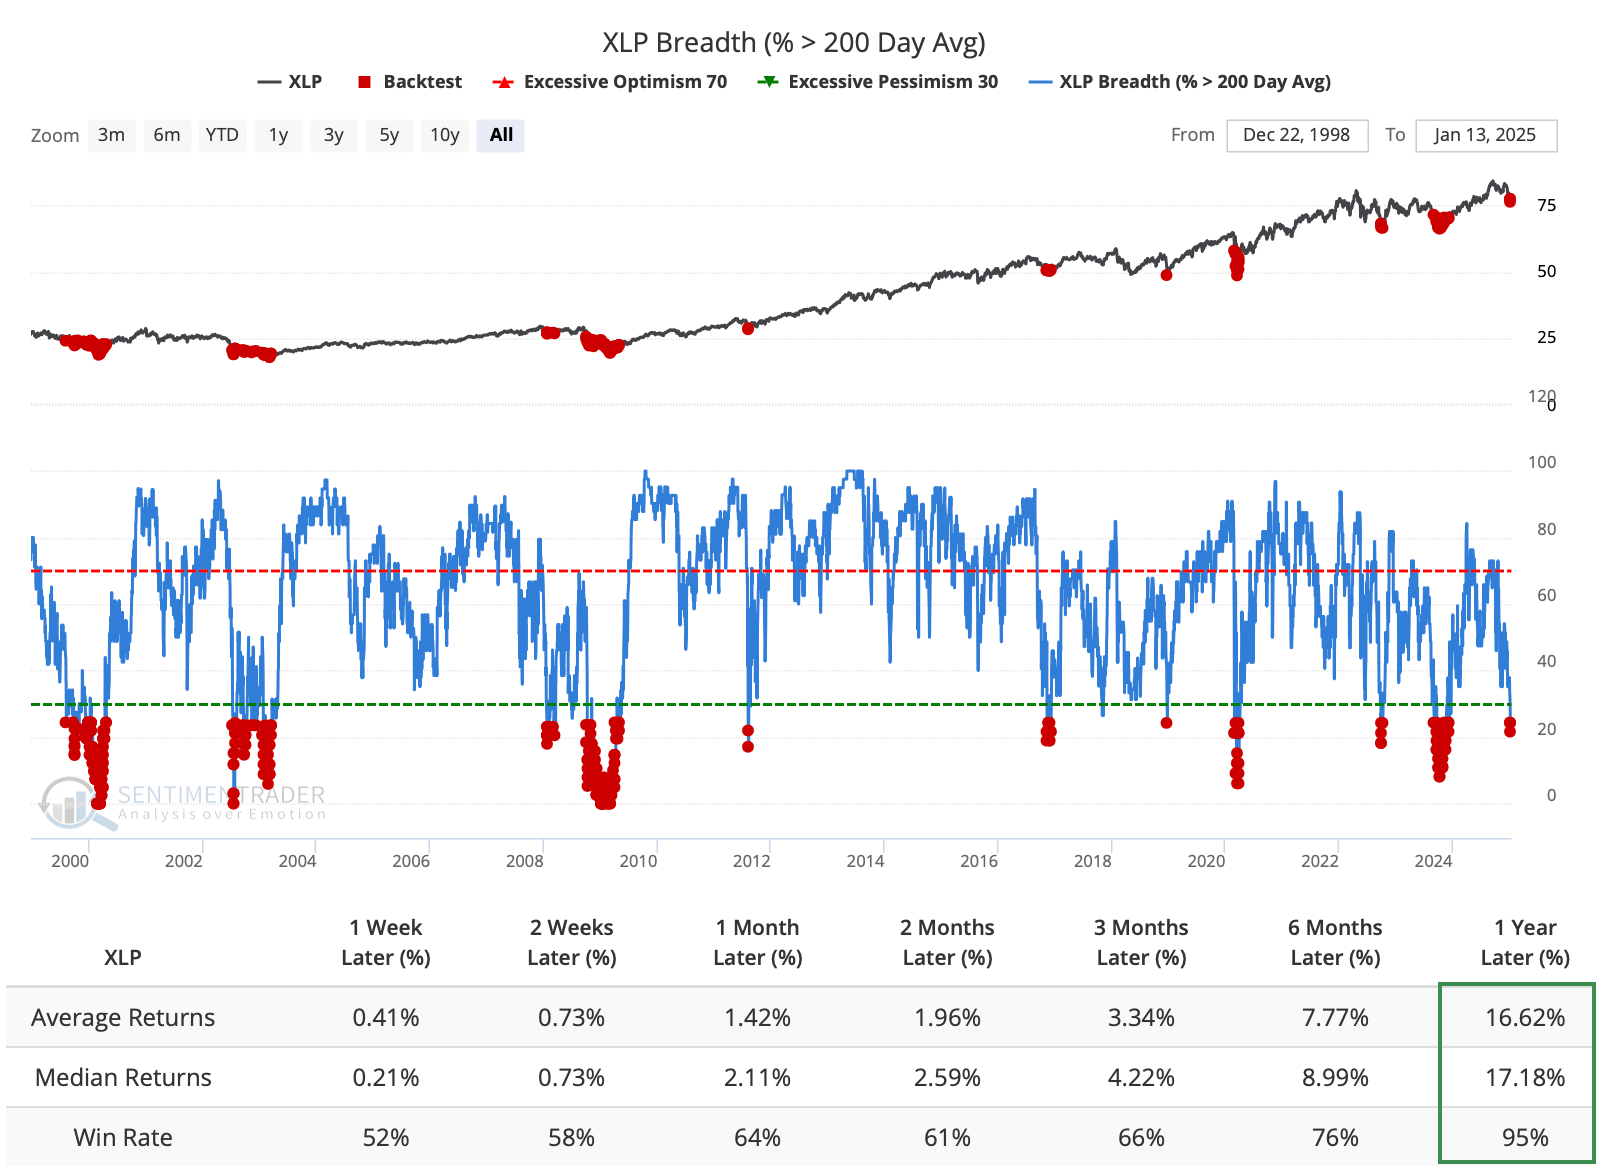
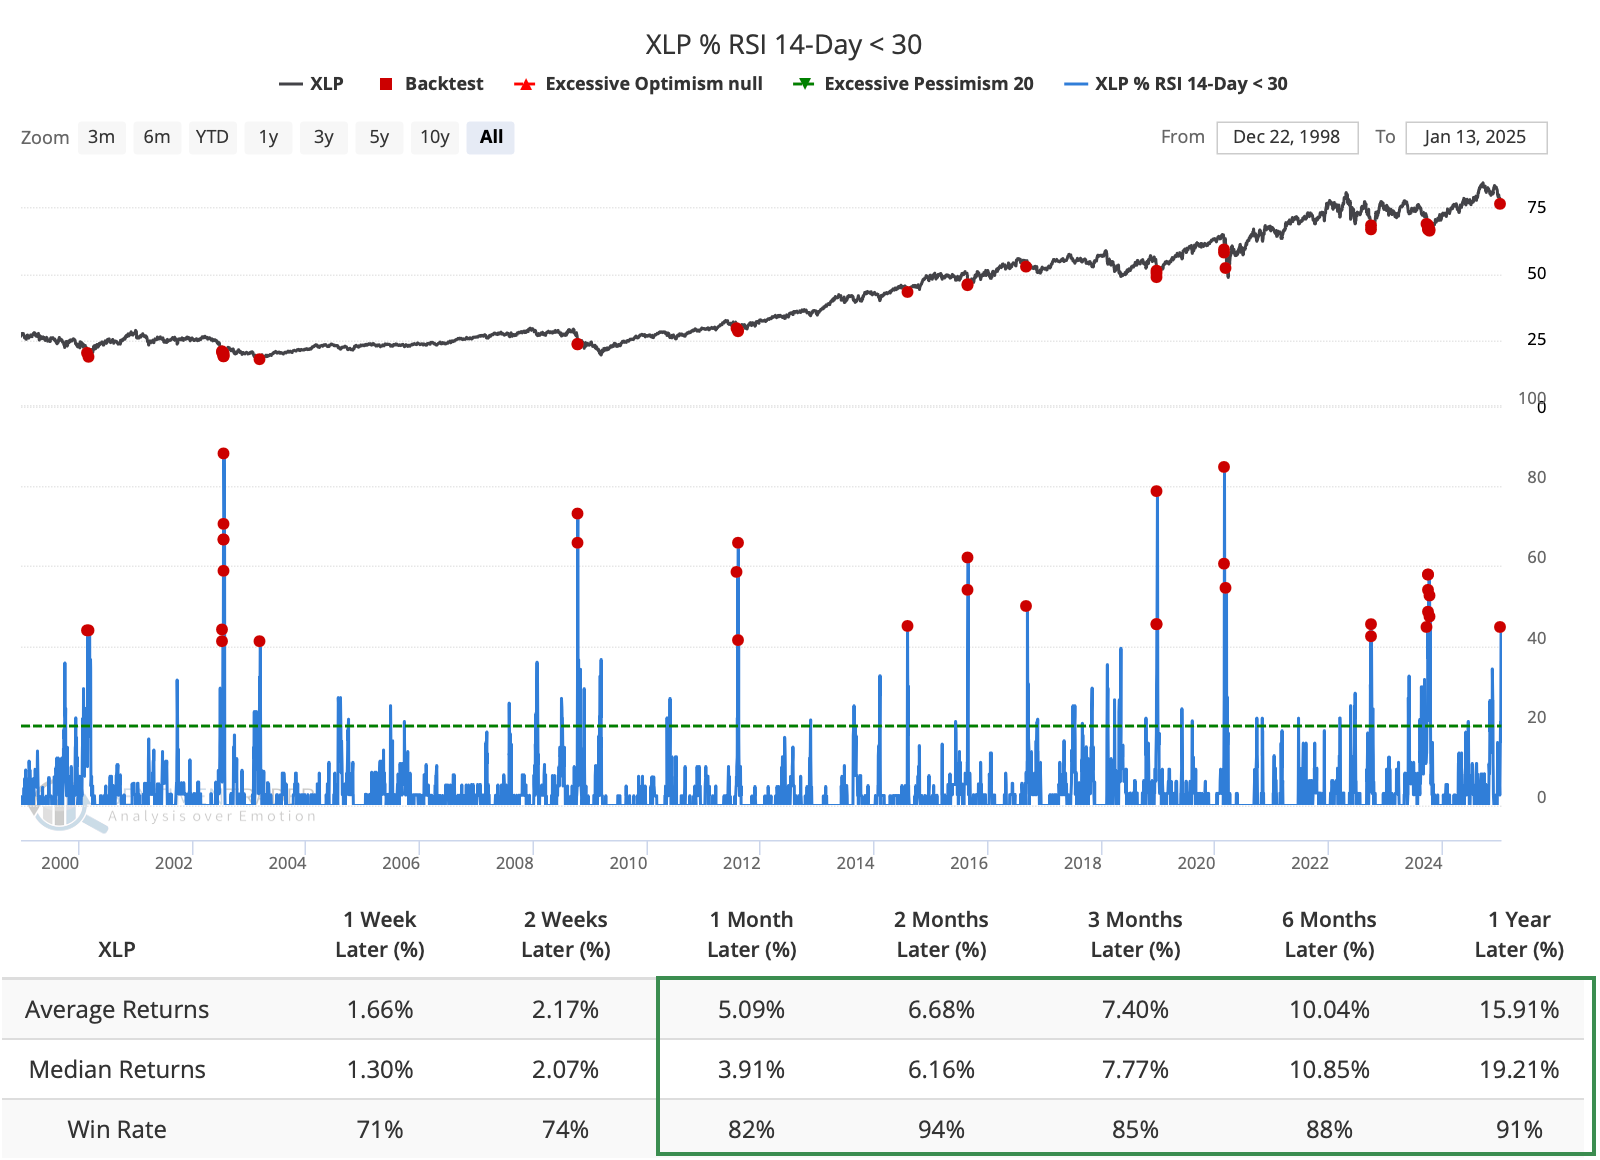
The selling pressure triggered several extremes in indicators that get "spiky" when investors panic. For example, there has been a sudden and severe drop in the percentage of staples stocks trading above their 200-day moving averages. While it has gotten quite a bit lower during the worst declines over the past 25 years, XLP showed a gain after 95% of the days a year after readings this low.
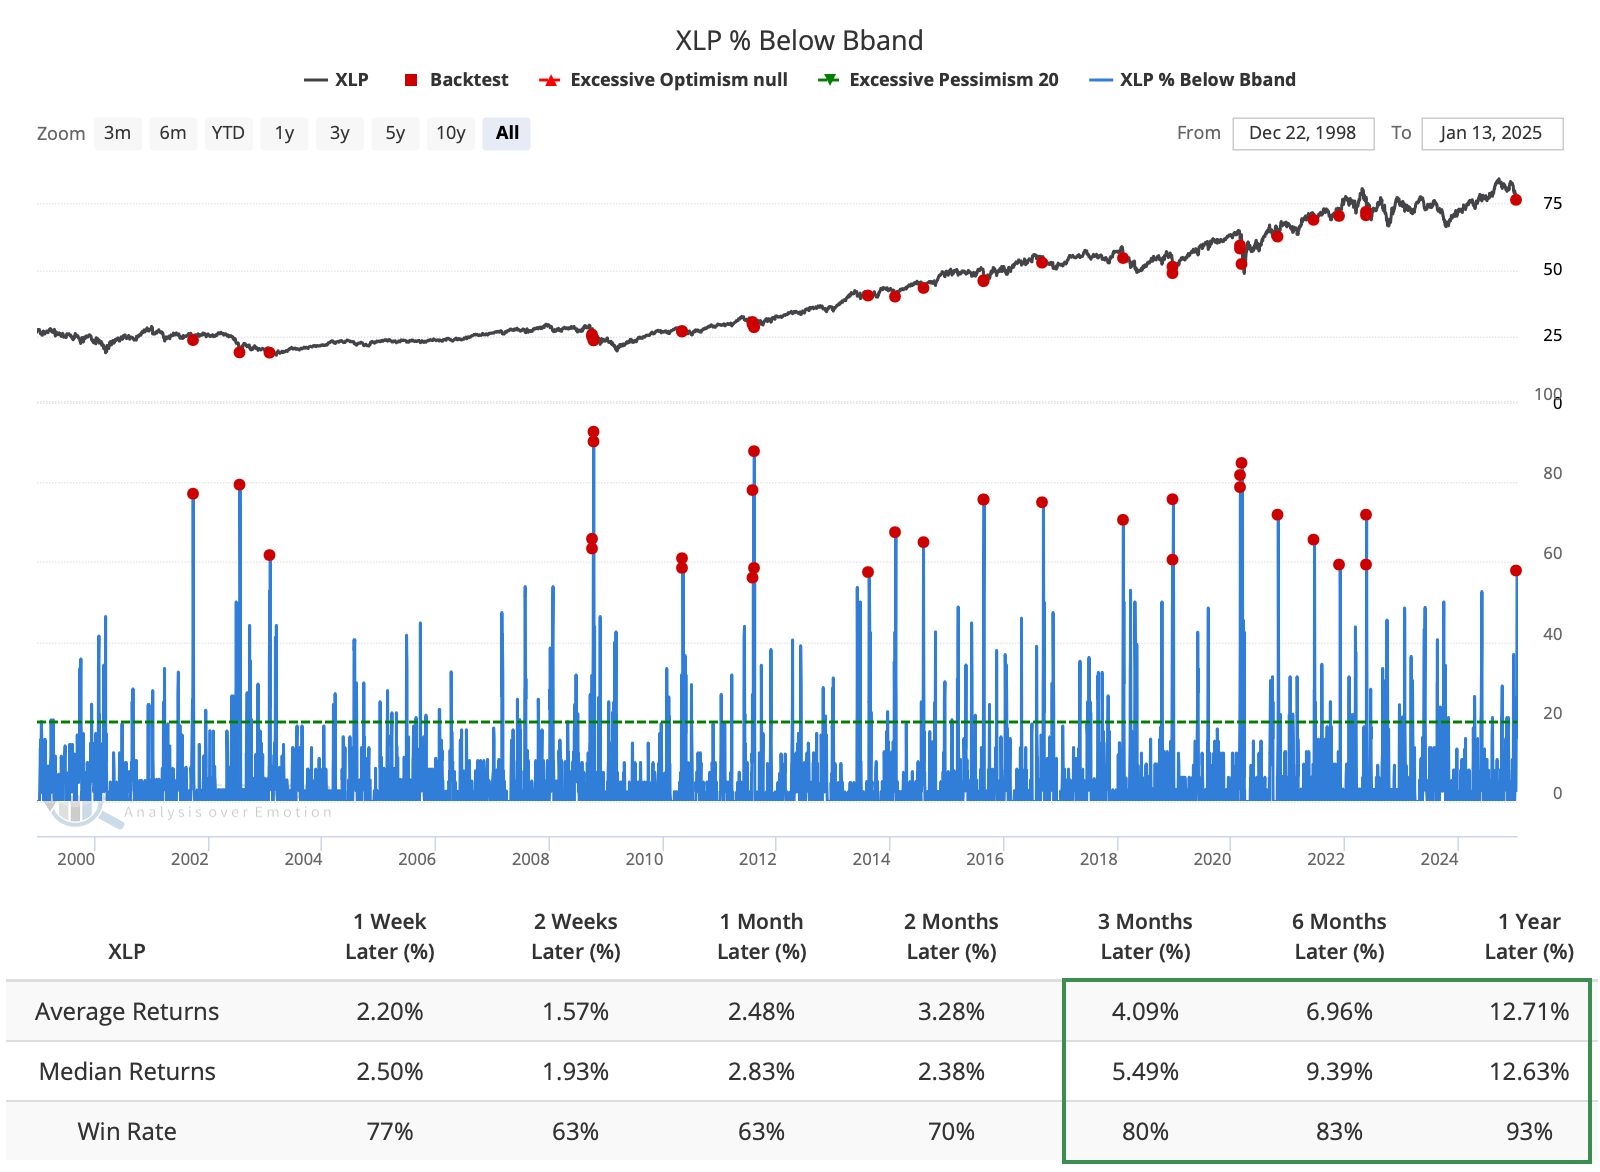
The sudden selling pressure the stocks have suffered over the past month has pushed many of them below their lower Bollinger Bands. When so many stocks fell below these volatility bands simultaneously, the XLP fund showed an above-average tendency to rally over the following 3-12 months.
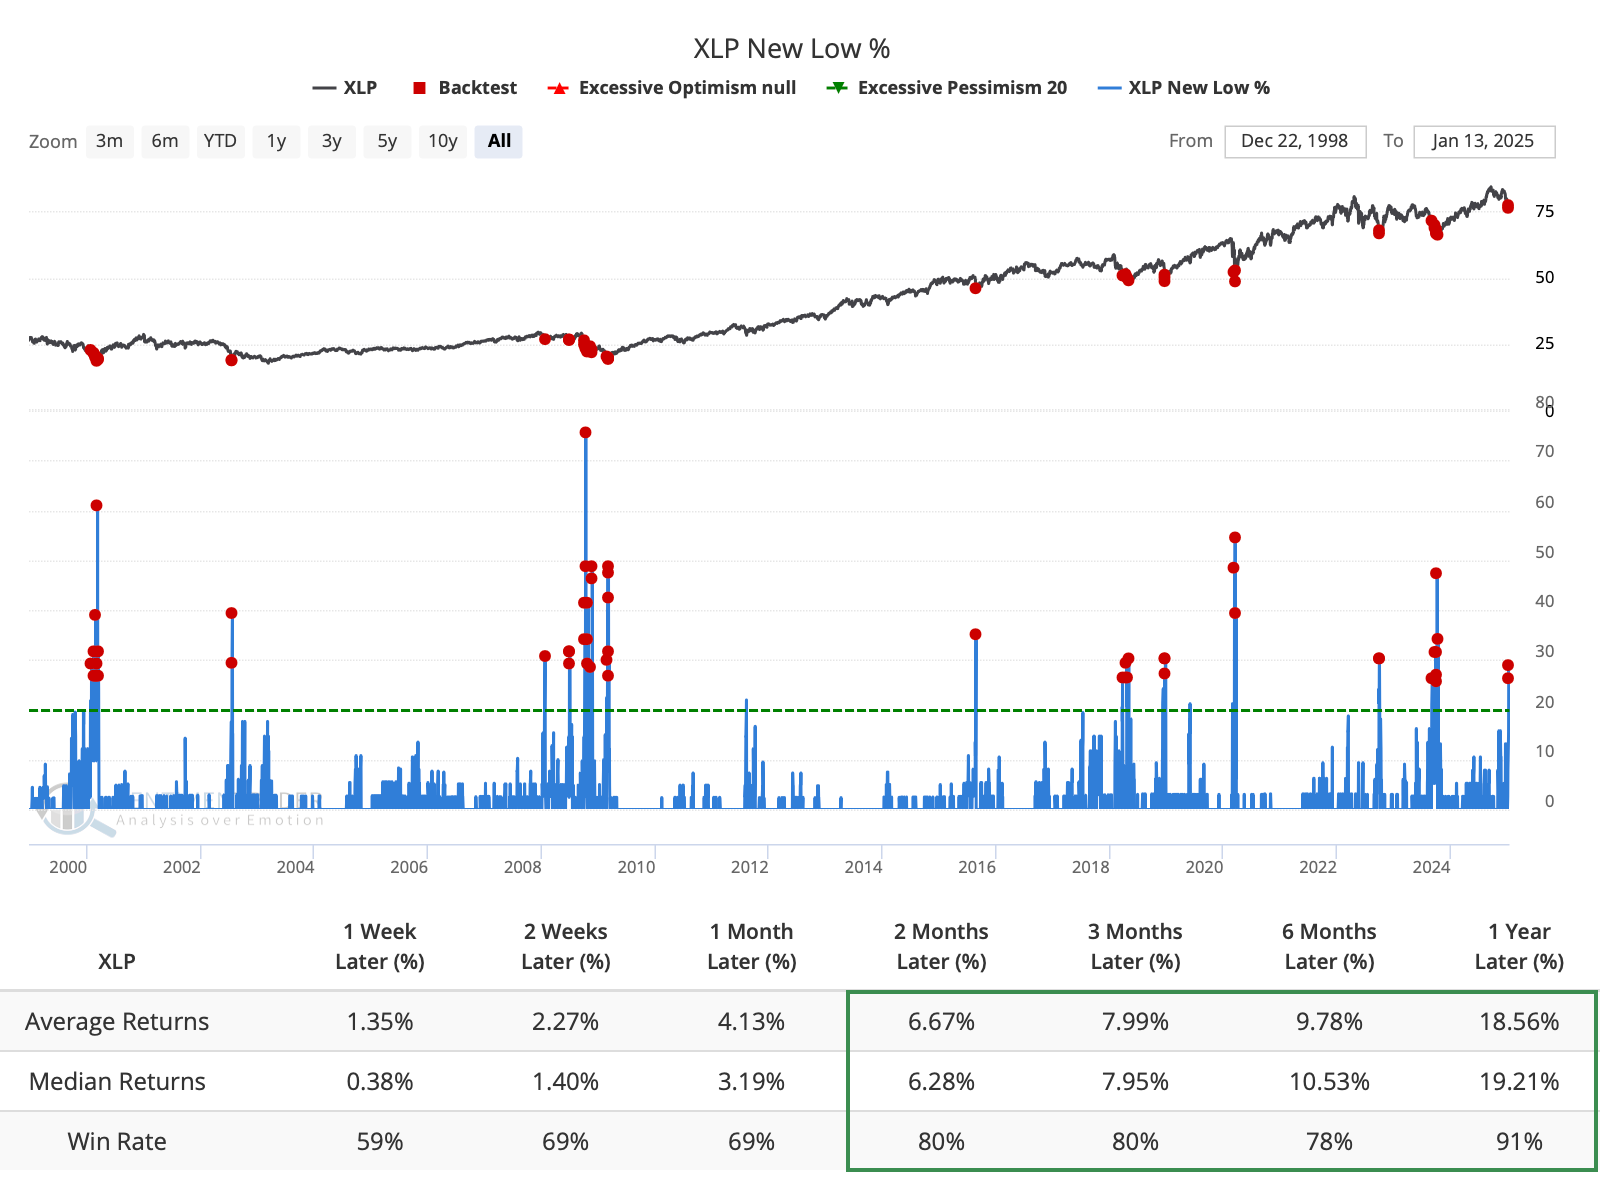
We see something similar with the spike in consumer staples stocks hitting a 52-week low. More than a quarter of the stocks hit a low on the same day, which again showed a tendency to lead to above-average returns, with consistency, from 2 to 12 months later.
With so many stocks suffering severe and persistent pressure, with many falling to new lows, it's no surprise that many of them - nearly half - are technically oversold. When so many of these defensive stocks hit oversold readings concurrently, XLP rebounded over the next two months 94% of the time.
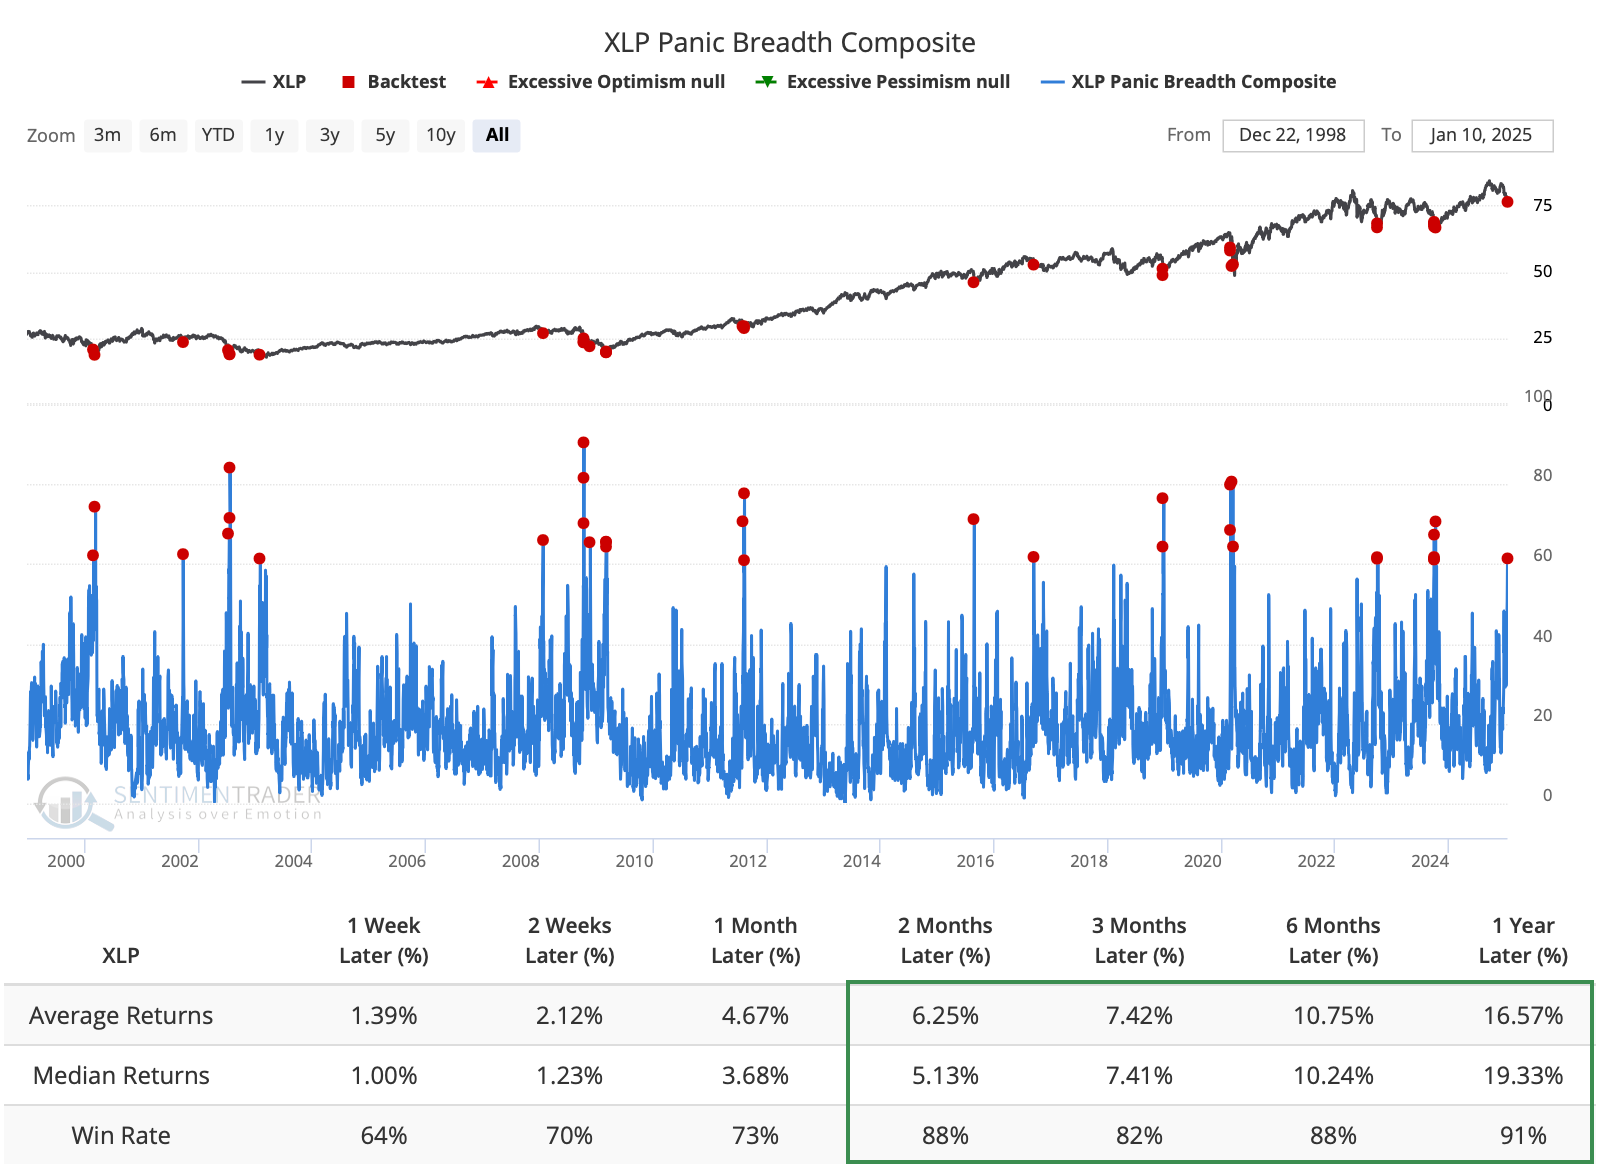
The Panic Breadth Composite aggregates a number of these indicators into one measure. It is designed to spike to a high level when a broad cross-section of breadth indicators show extreme readings at the same time, and it just did so, reaching 60%. After similar extremes over the past 25 years, XLP showed a strong tendency to rise over the following 2-12 months.
A confluence of signals
It's pretty rare to see extremes in these indicators trigger all at once. The chart below shows how many of these "spiky" oversold types of indicators triggered on the same day.
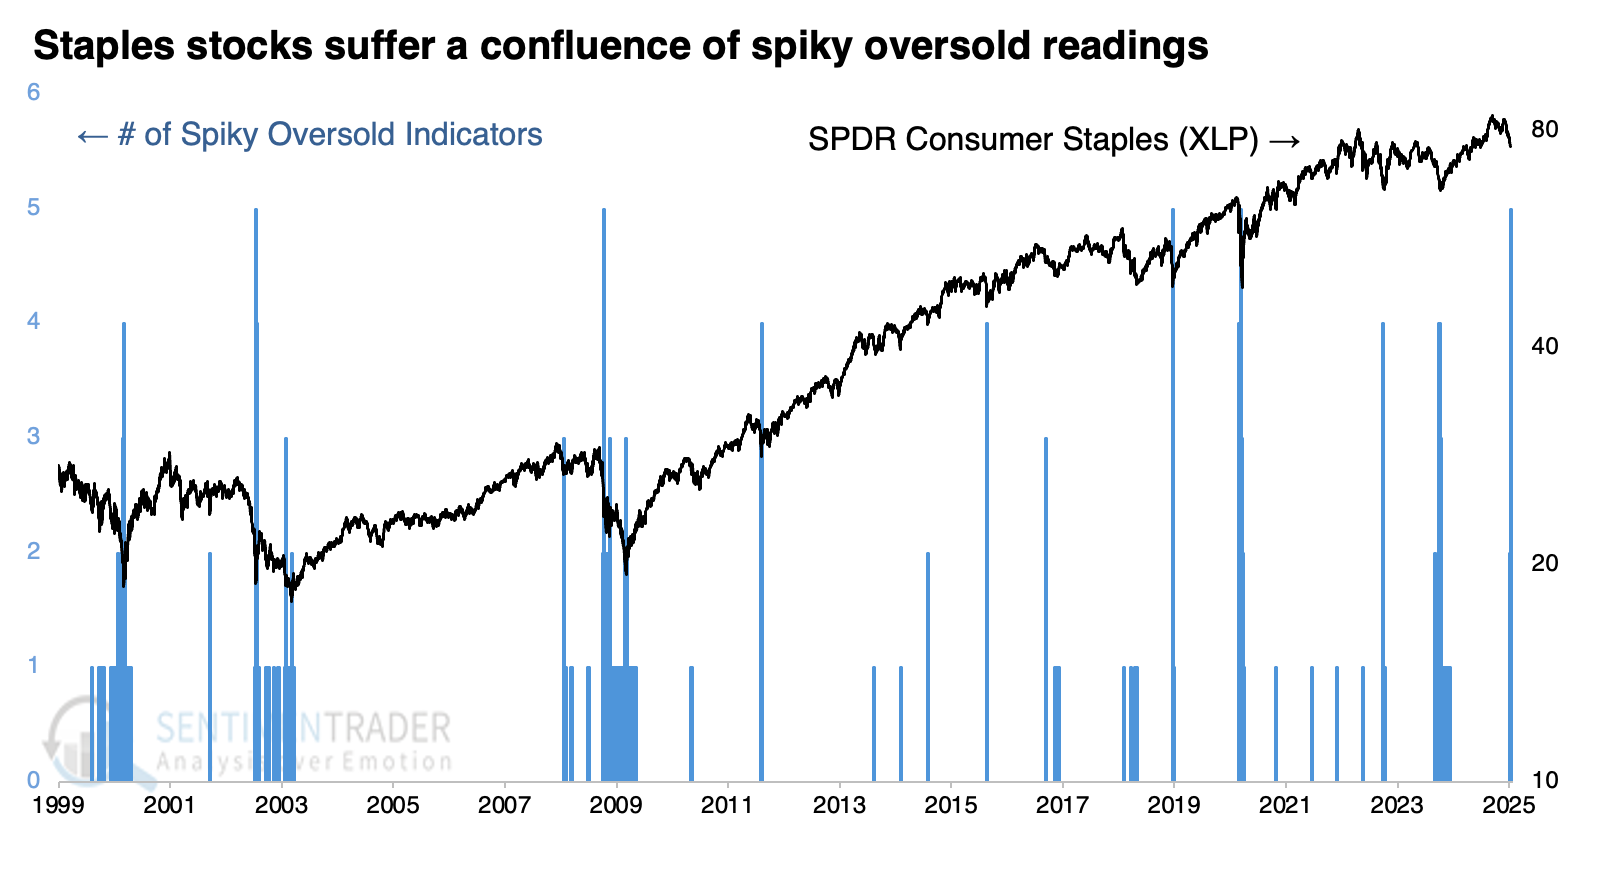
The fund suffered such a confluence only five times over 25 years. While those declines were more significant than the current pullback, XLP rallied after each. The signal fired during the financial crisis, failed for a while, then aggressively erased the losses. That was somewhat similar to 2002, though the initial rally was larger after that signal.
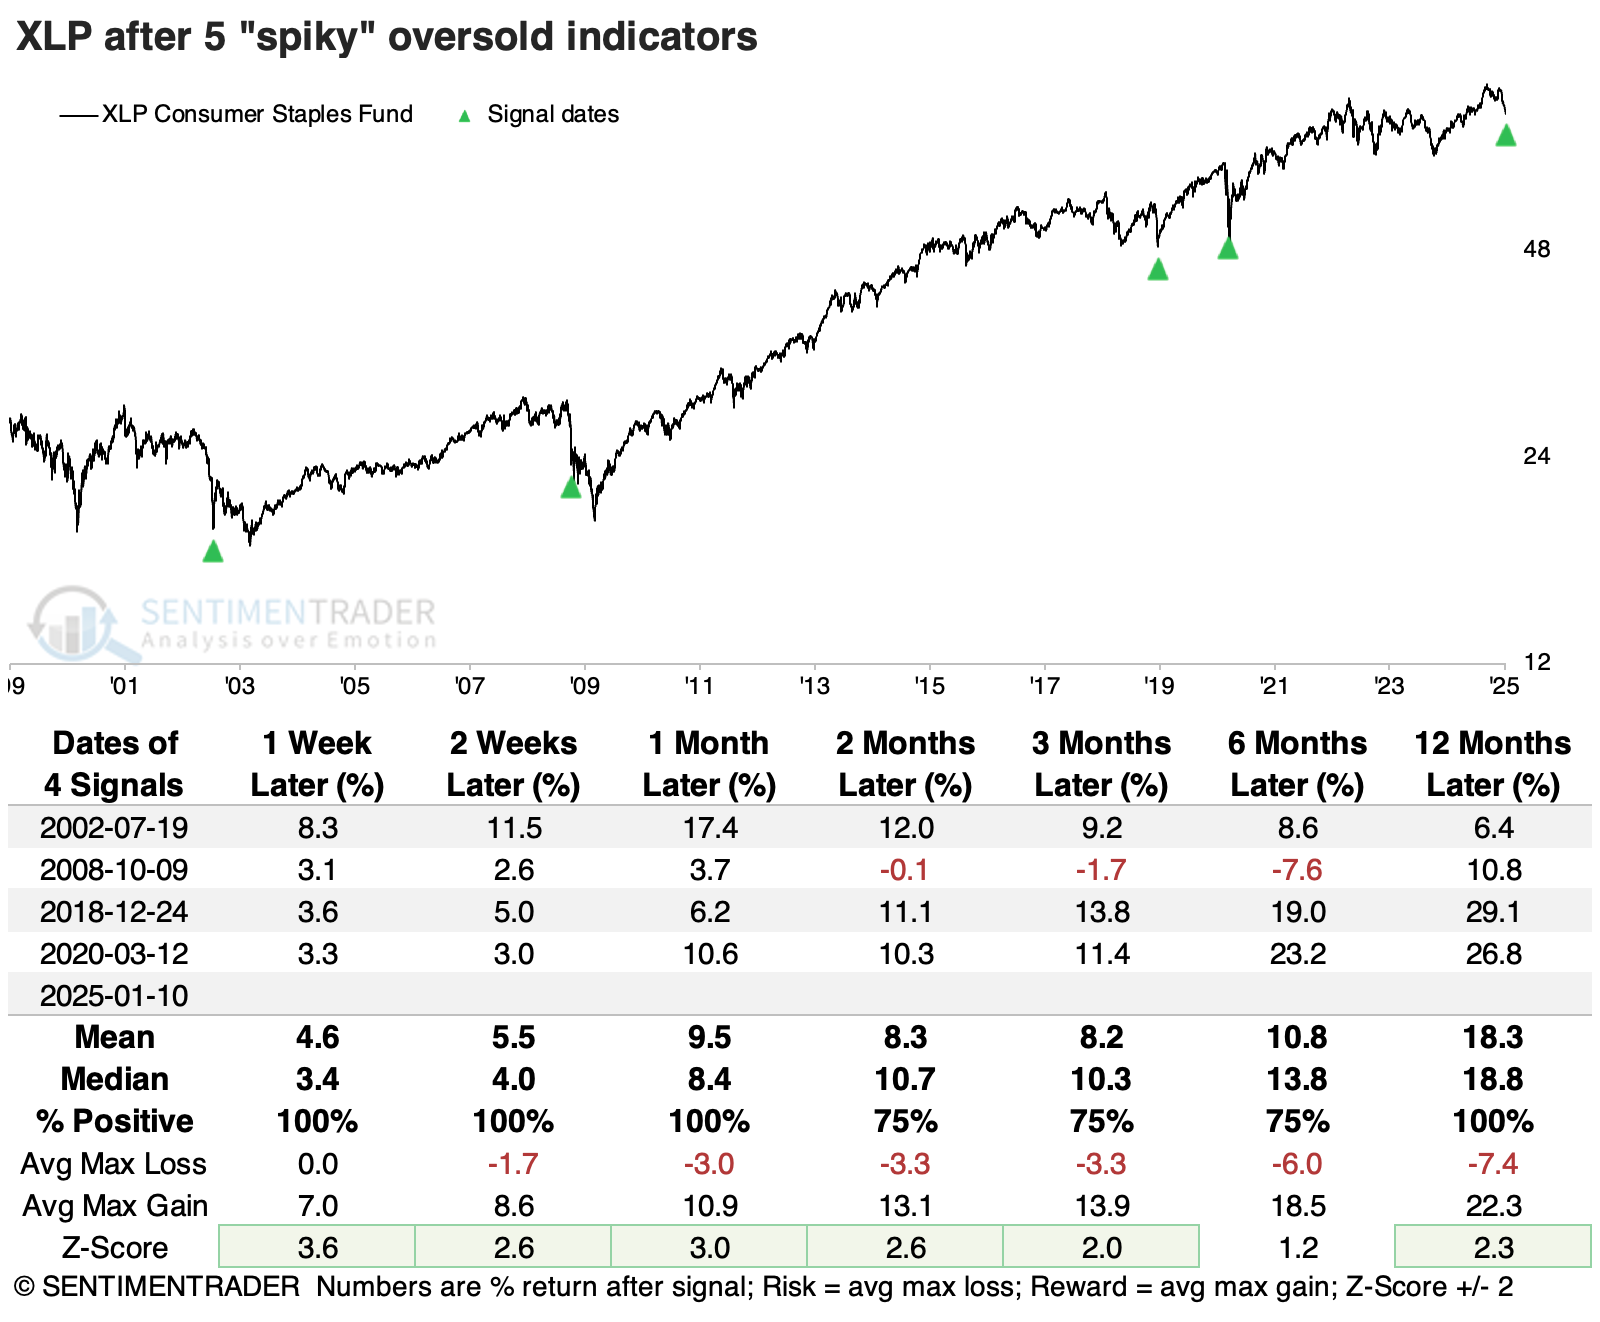
We can double the sample size if we require that at least four of the indicators trigger at the same time. Again, XLP showed a strong tendency to rebound across almost all time frames, with strongly above-average returns.
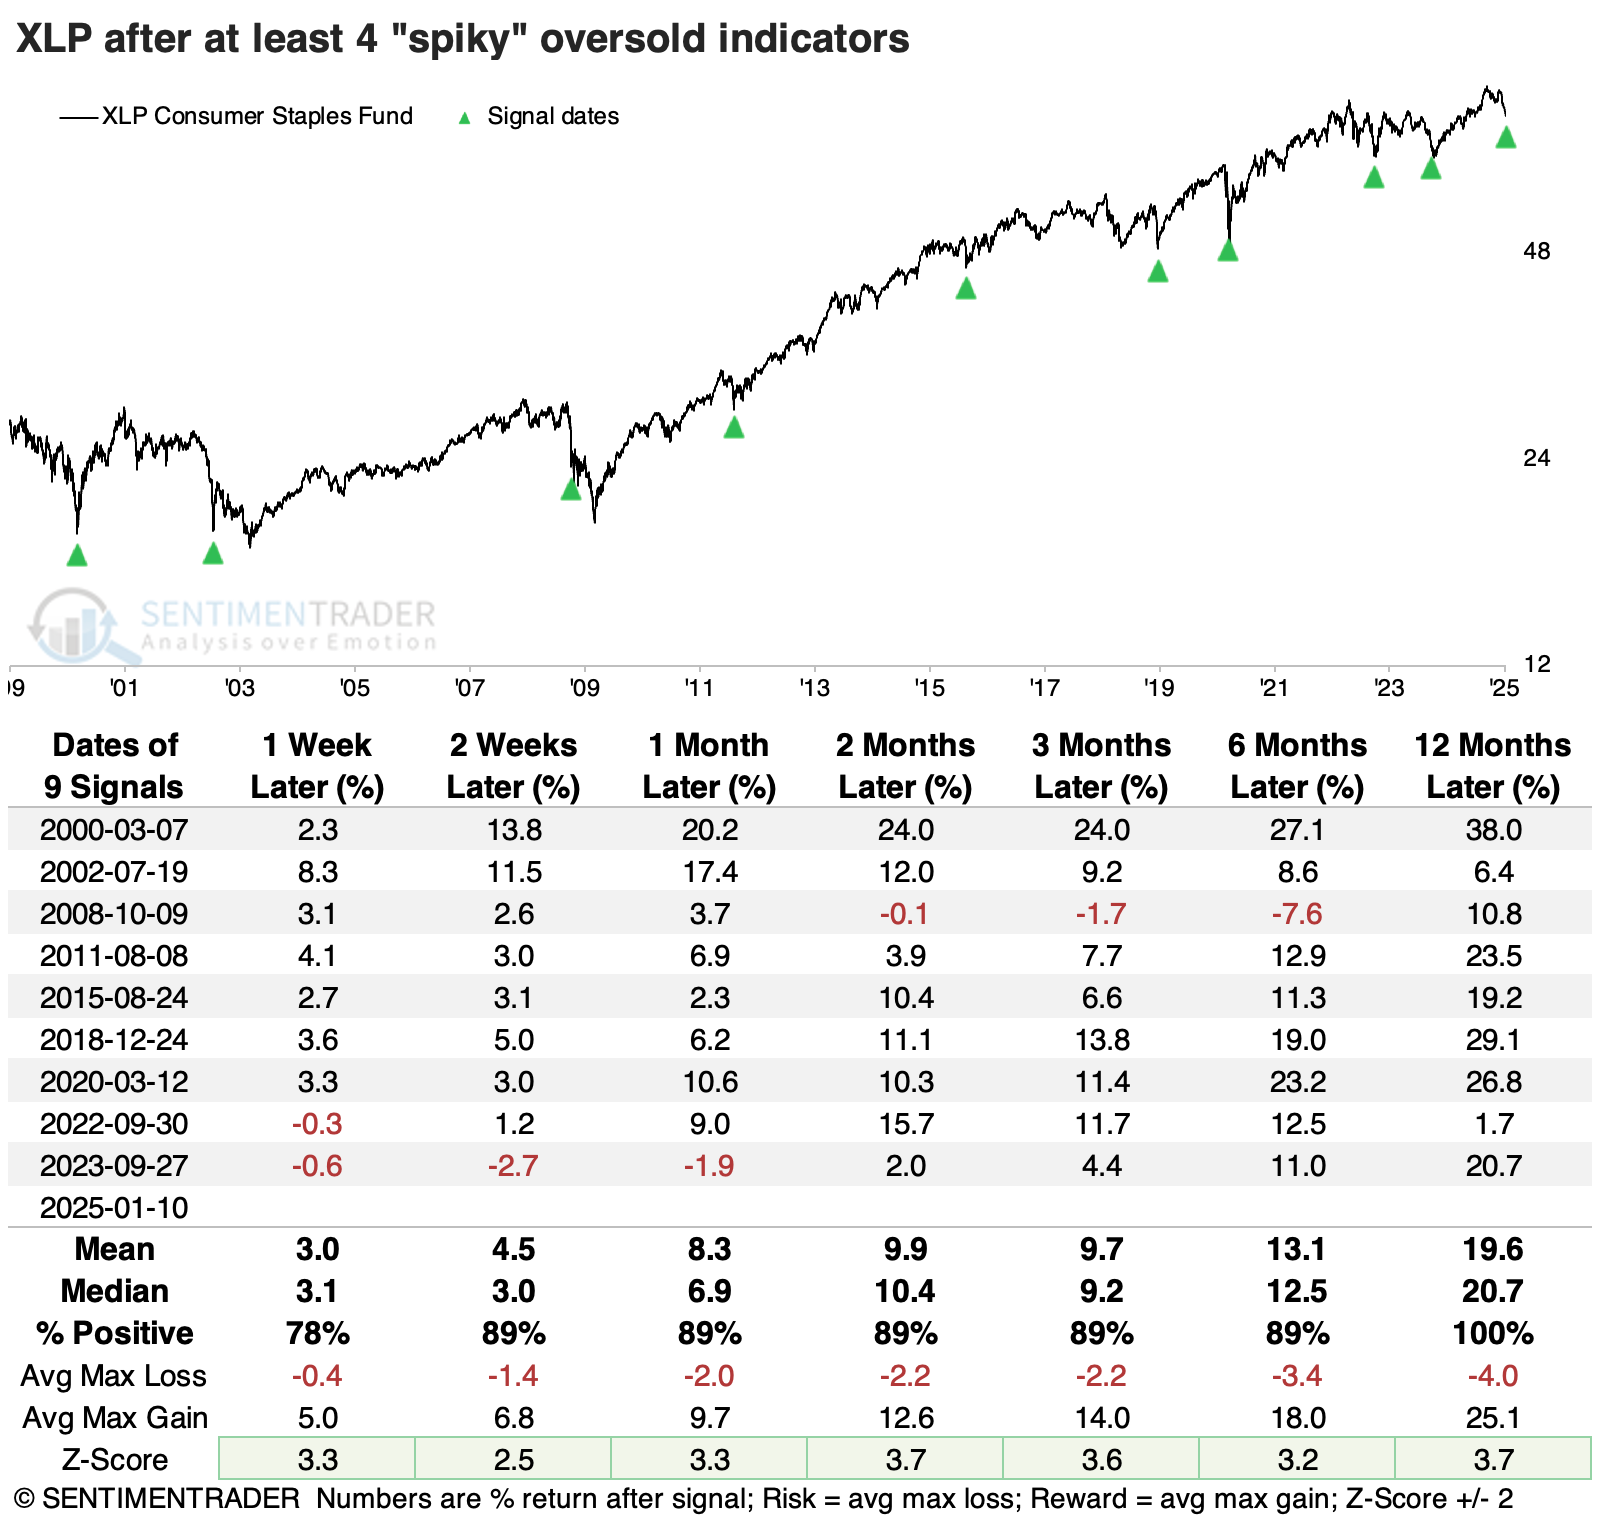
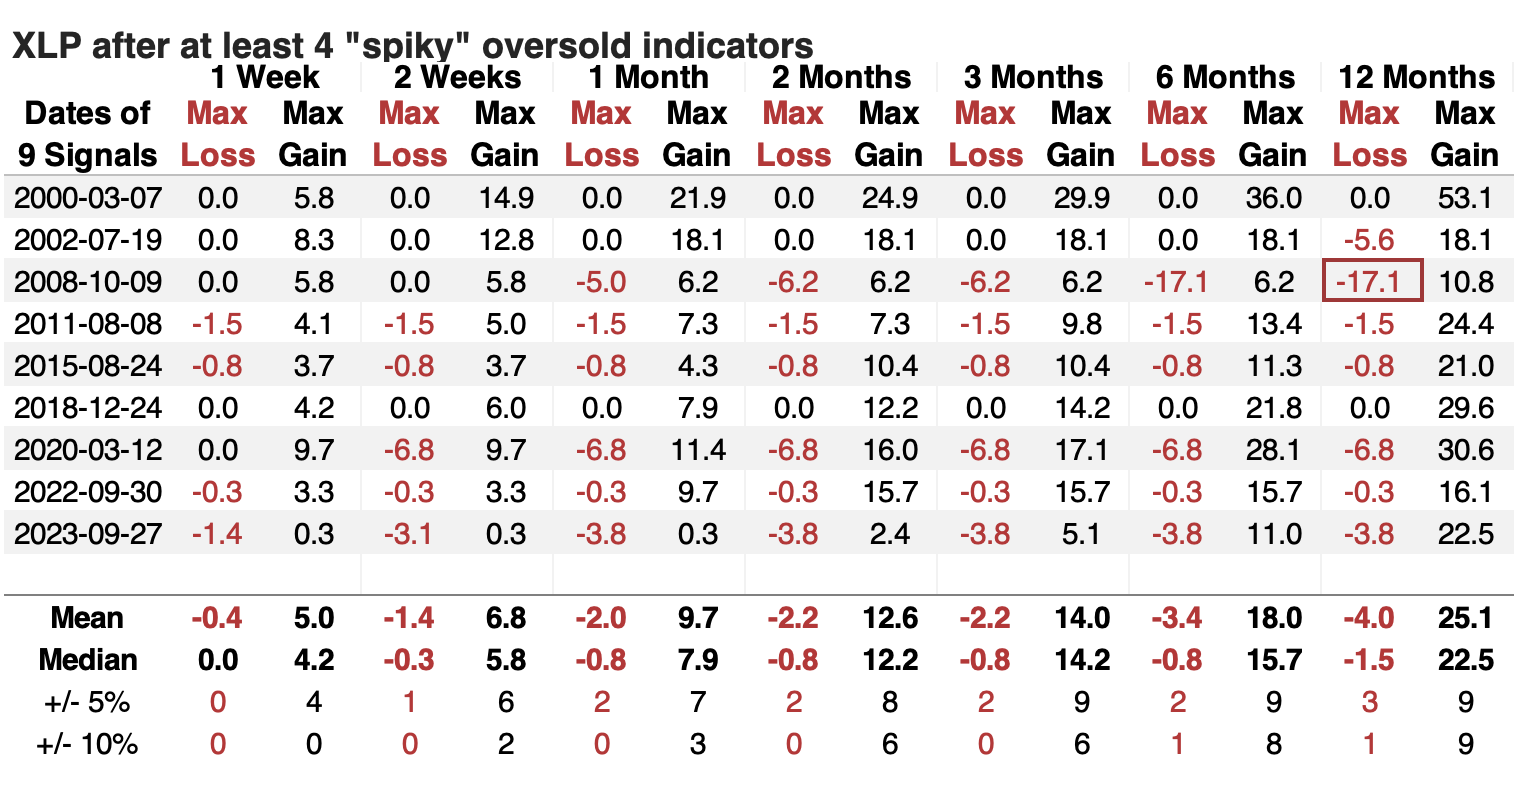
A table of maximum gains and losses across time frames shows us that only the 2008 financial crisis signal suffered more than a -10% decline at any point within the following year. None of the other signals suffered more than a -6.8% loss up to a year later, while all enjoyed a maximum rally of more than +10%.
What the research tells us...
Investors have been willing to shift their sector allocations aggressively over the past few weeks, with staples, materials, and health care suffering the worst buying strikes. The selling pressure in staples has been particularly sudden and severe, triggering spiky oversold readings in several different indicators.
When there has been a confluence of spiky oversold readings in this sector, the XLP fund has a nearly unblemished record of recovering in the months ahead, at least over the past 25 years. The risk of a significant decline has been nearly absent outside the global financial crisis, even up to a year later. For those looking for more defensive holdings, moves like this can serve as a way to add exposure with historically limited risk.