
Sell (corn) in May and go away

Key points
- The phrase Sell in May and go away is well-known among stock traders
- As it turns out, the term may be even more appropriate for the corn market
- Corn has had a dreadful year so far in 2023
- The most unfavorable time of year begins June 1st
The annual seasonal trend for corn futures
The chart below displays the annual seasonal trend and the average monthly returns for corn futures.
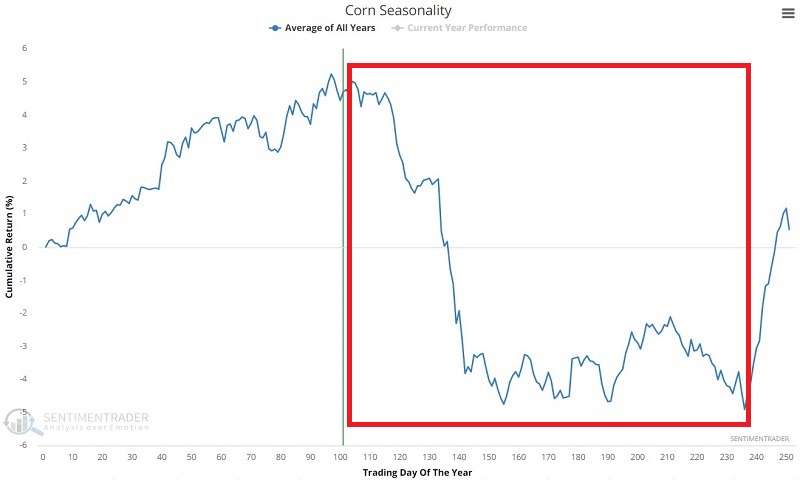
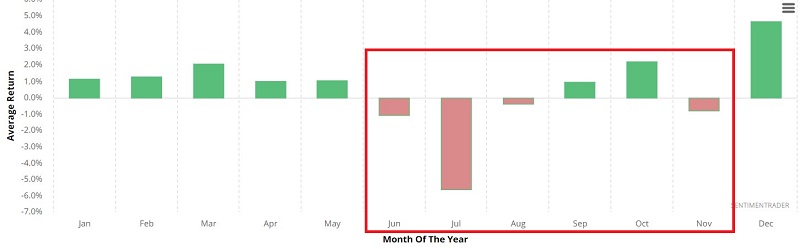
Note that December through May tend to be good performers, while June through November tends to show weakness. This is due primarily to the planting cycle in the Midwest, where much corn is grown.
The period of peak doubt regarding a given year's crop is typically when there is no corn in the ground (winter months) and through the planting season (spring). During these times, buyers tend to pay a premium for corn futures because there is no way to know precisely how much will be harvested during the upcoming growing year. Thus prices tend to rise. Once everything is planted, assessing the current year's crop prospects is much easier, and that pressure is often (though not always - for instance, during a drought year) relieved. When the pressure is relieved, prices tend to drop.
During the current year, the mild winter in the Midwest combined with a moderate spring has led to somewhat ideal planting conditions. The expectation is that plenty of corn will be harvested later this fall, so corn prices have been declining for most of 2023.
The question for traders is, "How consistent are these trends?" Let's take a closer look.
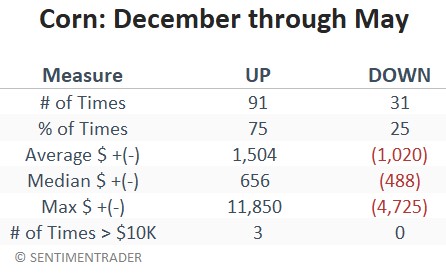
December through May for Corn
The chart below displays the hypothetical cumulative $ +(-) achieved by holding a long position in a corn futures contract only from December through May every year starting in 1901.
Two things are readily apparent: the long-term trend is positive. However, there are no guarantees from year-to-year and sharp declines are always possible. The bottom line - it is important to remember that a "tendency" does not equal a "sure thing."
The table below summarizes corn performance from December through May.
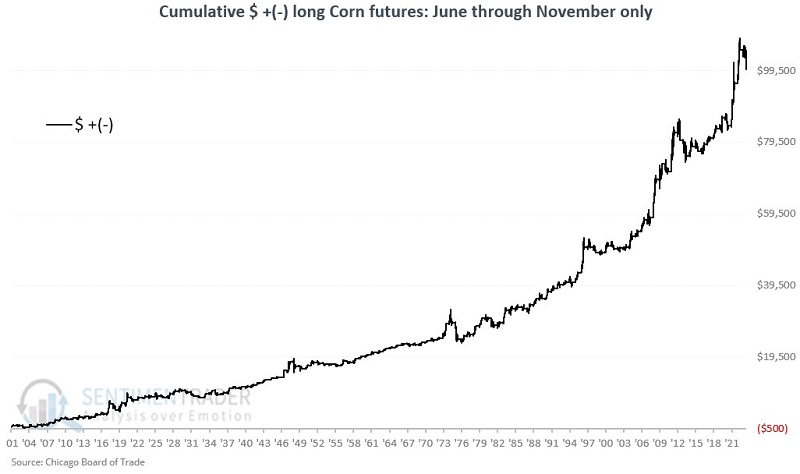
June through November for Corn
The chart below displays the hypothetical cumulative $ +(-) achieved by holding a long position in a corn futures contract only during June through November every year starting in 1901.
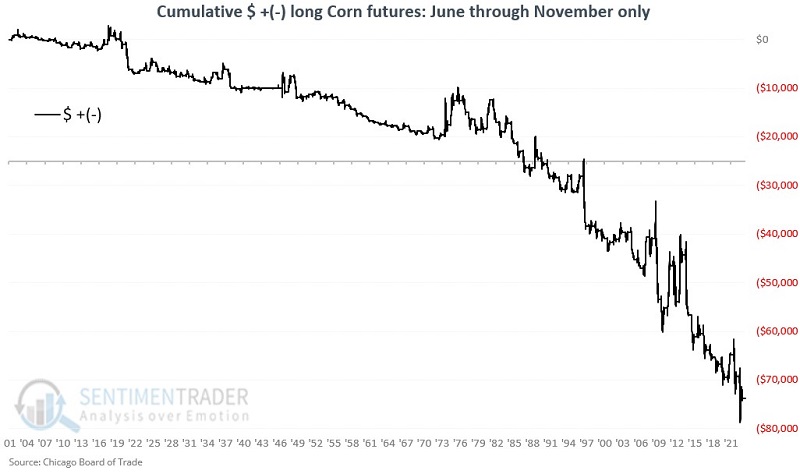
Once again, two things are readily apparent: the long-term trend is negative. However, there are no guarantees from year-to-year and extremely sharp counter-trend rallies are fairly common.
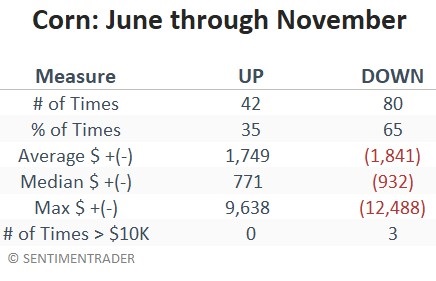
The table below summarizes corn performance from June through November.
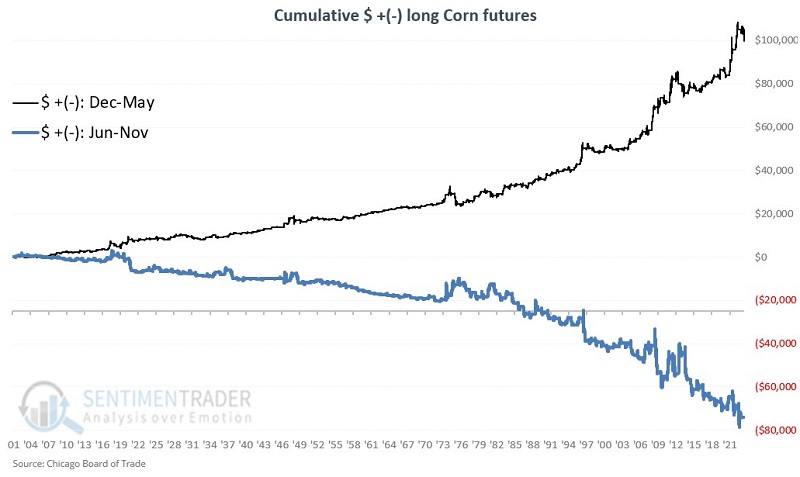
Putting the two periods together
The most straightforward approach for a futures trader would be to hold a long position in corn futures from December through May and a short position from June through November. The chart below combines the two charts above to emphasize the potential edge of being long during the favorable months and short during the unfavorable months.
The good news is that the hypothetical gain on a 1-lot combining long and short positions exceeds $173,000, compared to a gain of roughly $28,500 from simply buying and holding a long position in corn futures since 1901. This comparison appears in the chart below.
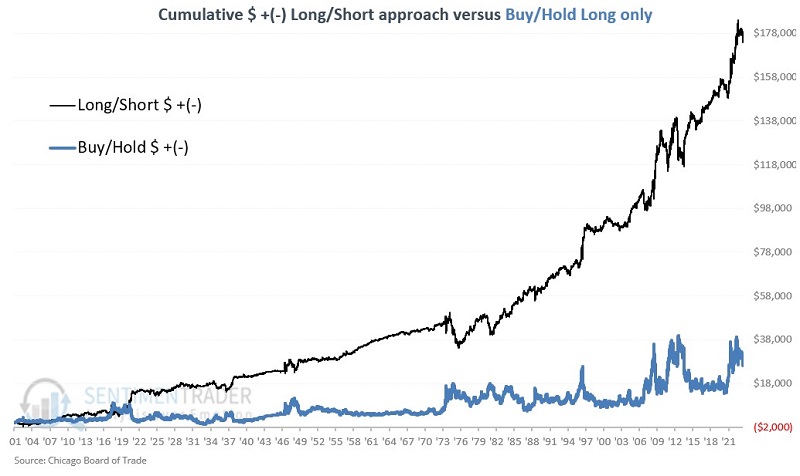
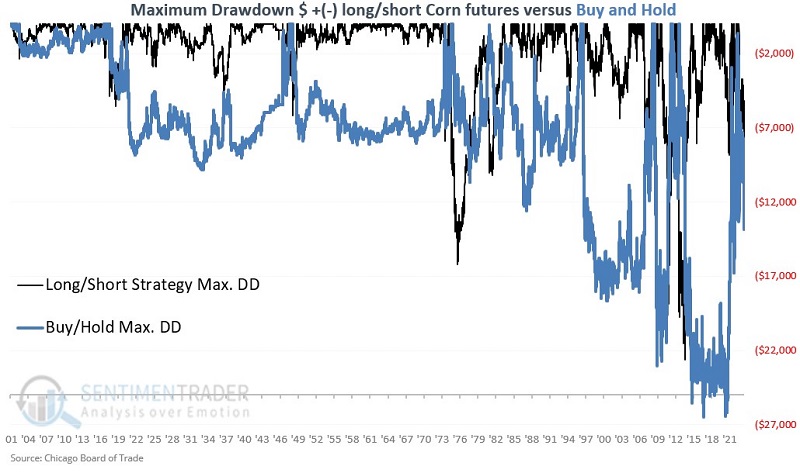
Traders need to note that while the long/short strategy may improve the long-term odds of success, it has limitations as a standalone strategy and does not relieve a trader of the responsibility of managing risk. The maximum drawdown for the long/short approach was -$22,613 during 2012-2013. This is similar to the buy-and-hold maximum drawdown of -$26,488 and is not something that most traders are willing or able to "ride out."
What the research tells us…
As always, seasonality is climate, not weather. That corn is a seasonal market cannot be debated. Strength is the tendency from winter into late spring, and weakness prevails from late spring into winter. Whether this information can be used as a standalone method is open to debate. Most likely, the best approach is to combine other trading methods (technical and/or fundamental) with these seasonal tendencies and to look for opportunities to primarily trade the long side during December through May for opportunities to primarily trade the short side during June through November.