
Sectors in April

Well, it's not exactly flowers in May.
What will April 2021 hold for the stock market, and various market sectors? As always, the truth is that it is impossible to know for sure in advance. But one can look at historical tendencies and develop a sense of which areas of the market may offer the best odds.
In the table below:
- The first line of data displays the total return for each sector ONLY during the month of April from 12/31/1926 through 12/31/2020
- Each subsequent line displays the decade-by-decade total return for 11 sectors if held ONLY during the month of April each year within that decade
- The 1920s are excluded because they included only 3 years of data
- The last line is extended one year to include 2020
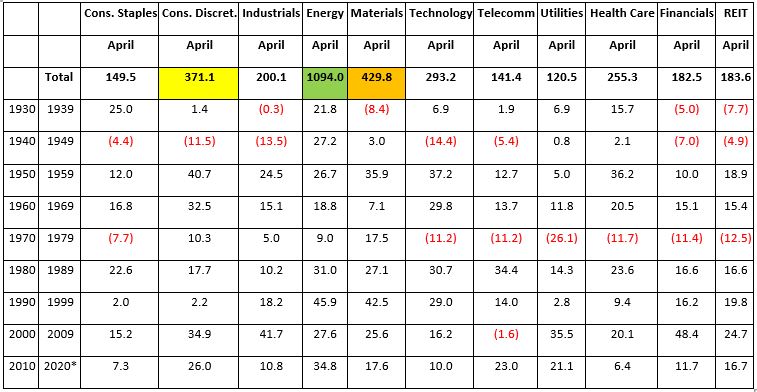
The first thing one notes is that Energy has apparently been the "King of April" over the past 90+ years. Materials and Consumer Discretionary place 2nd and 3rd in terms of total return.
When preparing to move from analyzing data to actually trading, it is important to get a sense of the consistency of returns rather than assuming that the one with the highest absolute return is the best choice. Overly volatile returns are the bane of any investor and everyone wants to make as much money as they reasonably can.
However, in the real world, if the volatility of the fluctuations of the equity in one's account exceeds one's own threshold for risk, then the odds of abandoning a perfectly good approach to investing or trading increase exponentially, and a viable strategy can get thrown out the window - usually at exactly the wrong time.
Hence the reason I - like a lot of investors - tend to focus on reward vs. risk as opposed to focusing solely on raw return.
To wit:
Jay's Trading Maxim #28: When assessing any trading system/method/technique with positive expectation, the real question is not "what kind of returns can I expect"? The real question is "what is the likelihood that I will stick with this sucker long enough to actually do me any good?
Which flows directly from:
Jay's Trading Maxim #27: When it comes to trading/investing, between theory and reality there can be a chasm a mile wide.
High CAGR is great. But if you can't handle the heat when the temperature rises there is a good chance that you will likely ultimately do yourself more harm than good.
Sortino ratios and z-scores can be very helpful in this process. I have my own quick-and-dirty method which I will describe below. For the record, I make no claim that it is better or more useful than any other measure. It is simply - in the immortal words of Rod Serling - submitted "for your approval" (or not as the case may be).
In analyzing the data above a little more closely we will consider the following variables:
A = average decade % + (-)
B = median decade % + (-)
C = standard deviation of average decade %
D = A/C
E = (((A * B) / C) * D) or Calc* in the table below
F = Worst decade %
The table below:
- Shows these calculations based on the decade-by-decade results in the table above
- The top performer in a category is highlighted in green, the second-best in orange and third place in yellow
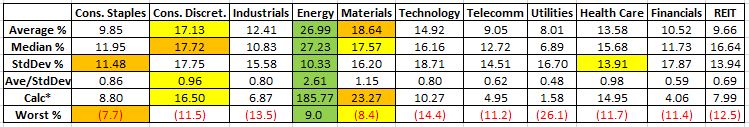
Consumer Staples and Health Care score a few points, but overall these calculations appear to confirm that Energy, Materials and Consumer Discretionary have in fact been the best overall performers during the month of April over the past 9 plus decades.
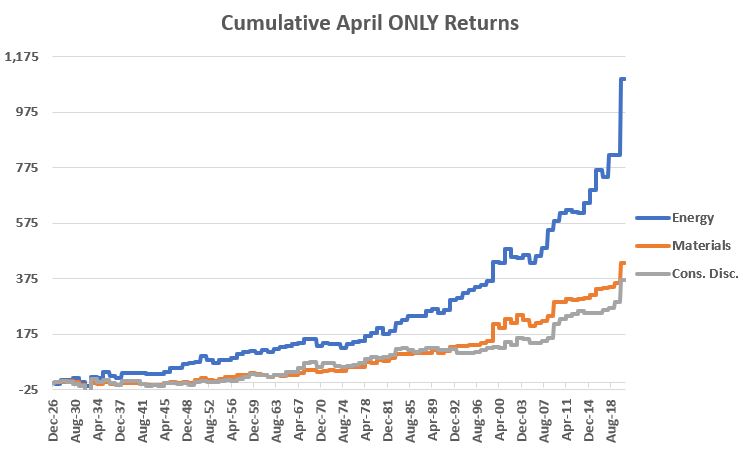
The chart below shows the cumulative % return for Energy, Materials, and Discretionary held only during the month of April from 12/31/1926 through 12/31/2020.
Now let's assume that one portfolio splits evenly between the Top 3 sectors every April and that another portfolio splits evenly among all 11 sectors. The chart below displays the cumulative total return from 12/31/1926 through 12/31/2020 for:
- 3 Sectors = Average return during April for Energy, Materials and Discretionary combined
- All Sectors = Average return during April for all 11 sectors combined
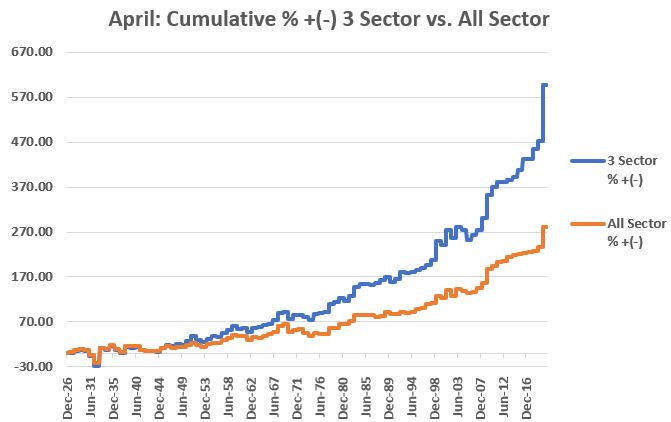
To assess the consistency of performance of the Top 3 Sectors versus All Sectors, the chart below displays the ratio of the growth of $1,000 invested ONLY in our 3 sectors ONLY during the month of April each year divided by the growth of $1,000 invested in all 11 sectors ONLY during the month of April each year.
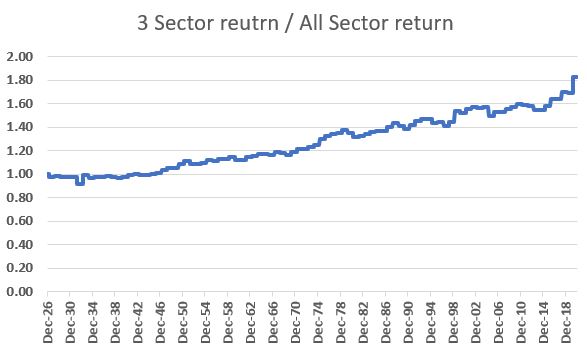
Let's talk real-world trading again for a moment.
At first blush, we can look at the chart above and see that over time the performance of the Top 3 keeps growing relative to the performance of All Sectors. This is reassuring - to a point. But more importantly, there are times when this line moves sideways to lower over the course of a number of years. Assuming for example's sake that you were using this method to trade the month of April - if it underperforms over the next 5 years, will you still make the same trade in Year 6?
This seems like an opportune time to invoke:
Jay's Trading Maxim #2: The keys to trading and investment success are, A) utilizing a method or methods that have a realistic expectation of generating profits over the long run, and B) having the financial and emotional wherewithal to follow your method(s).
Summary
So, does any of this mean that Energy, Material and Consumer Discretionary stocks are sure to a) perform well, and b) outperform other sectors during the month of April? Not at all.
And therein lies the tricky part of investing. No strategy/system/method is ever guaranteed to perform well "the next time around." Despite this reality, investors who wish to succeed must:
- Decide what to invest in (hopefully based on some objective basis in which they have a high degree of confidence)
- Allocate capital and manage risk (which is not discussed in this particular article)
- Follow their strategy/system/method long enough to derive the expected benefit
Hint: It can be harder than it sounds.