
Seasonality supports soybeans through July

Key Points:
- Certain markets tend to exhibit reliably repetitive seasonal tendencies
- The calendar year for soybeans can basically be split into two periods
- Beans are currently in the favorable period that lasts through next July
A simple guide to bean seasons
During one part of the year, soybeans are either not in the ground or getting planted and/or starting to grow. It is during this time that the size of the harvest for the coming year is unknown. This is also the time when doubt and fear are at their peak. These concerns tend to lead to higher soybean futures prices as end-users buy futures contracts to ensure they have enough supply.
During the other part of the year, soybeans are in the ground, and analysts can make fairly sophisticated estimates as to just how many bushels of beans will ultimately be produced. Once it becomes fairly clear what the harvest will be, doubt and fear tend to dissipate, and soybean prices typically level off and/or decline.
A tale of two time periods
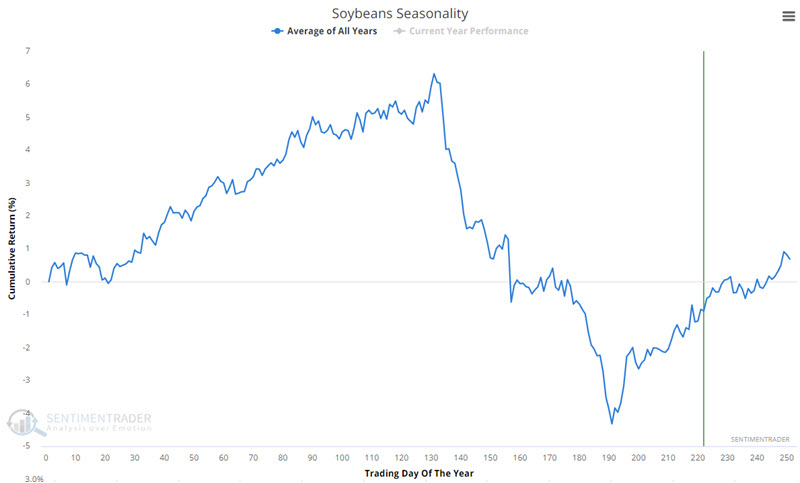
The chart below displays the annual seasonal trend for soybean futures.
There are two distinct periods:
- From trading day of the year (TDY) #191 through TDY #131 of the following year (roughly early October through early July)
- From TDY #131 each year through TDY #191 of the same year (early July through early October)
Is there any usual information to be discerned from this chart? Consider the charts that follow.
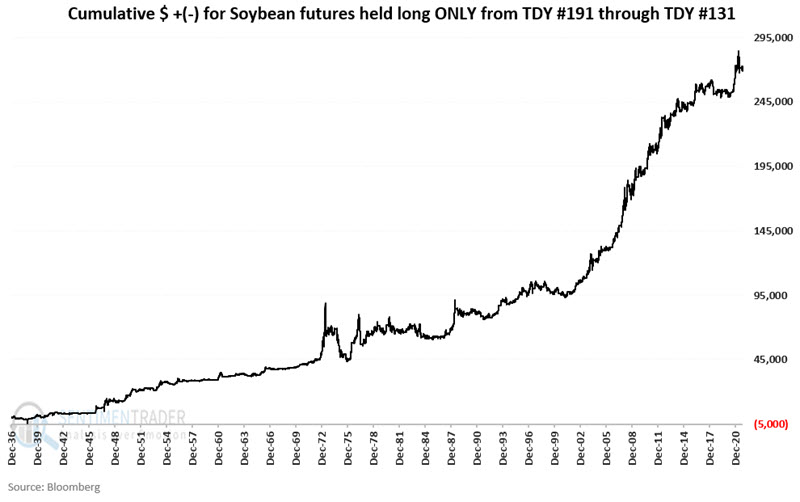
The chart below shows the cumulative dollar gain for soybean futures held long from the close on TDY #191 each year since 1937 and sold on TDY #131 the following year.
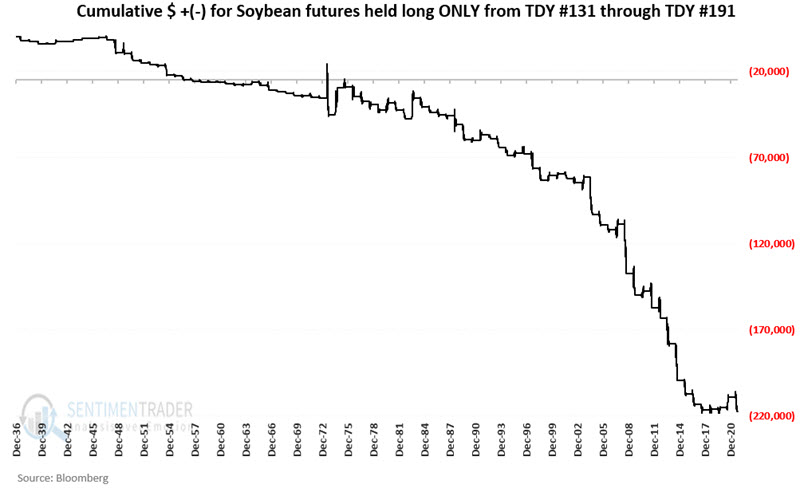
The chart below displays the cumulative gain for soybean futures held long during the other period, from the close on TDY #131 each year since 1937 and sold at the close on TDY #191 of the same year.
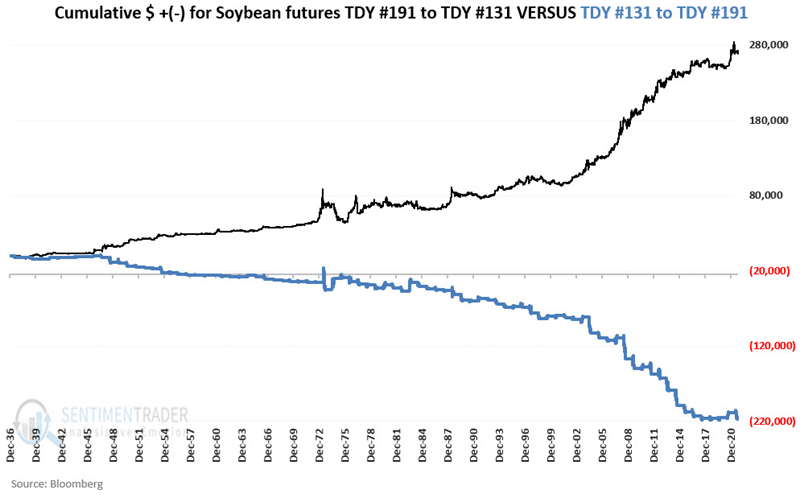
 If the differences were not obvious, the chart below displays the results of the two time periods together.
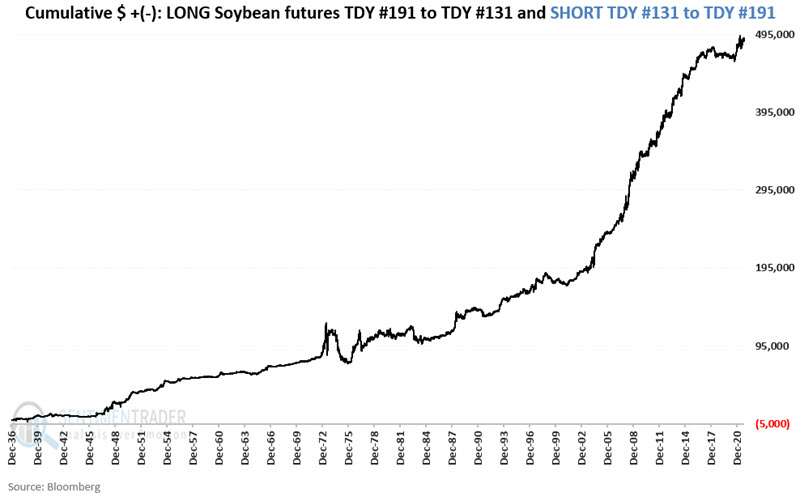
Now let's put the two periods together with an eye on actual trading. The chart below shows the hypothetical results from holding long soybean futures from TDY #191 through TDY #131 and short soybean futures from TDY #131 through #191.
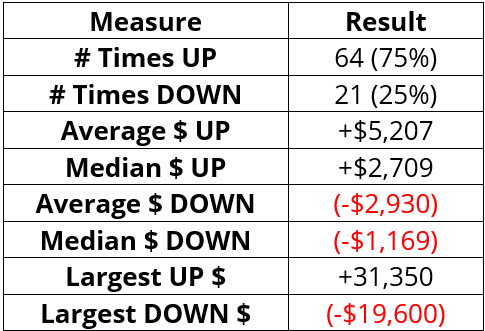
Favorable time period shows a 75% win rate
The table below presents the results for the favorable seasonal period (TDY #191 through TDY #131). Soybeans enjoyed a 75% win rate and an average gain of more than double the average loss.
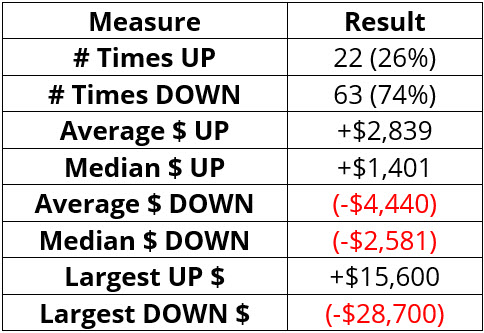
The table below shows the results for the unfavorable seasonal period (TDY #131 through TST #191). During these stretches, soybeans rose only 26% of the time, with an average loss significantly larger than the average gain.
What the research tells us…
Soybeans have a strong tendency to rally from early October into early July of the following year. Conversely, soybeans tend to decline from early July into early October. Many factors can ultimately influence the price of soybeans, particularly in the short-term. But barring other unfavorable factors, seasonality suggests giving the bullish case for beans the benefit of the doubt for the next eight months.