
Seasonality and gasoline

Key Points
- Unleaded gas is one of the most cyclical markets around
- Within the calendar year, there are several reasonably consistent bullish and bearish periods
- While unleaded gas futures are the purest play, there is an ETF alternative that can allow more traders to participate
Unleaded gas seasonality
The chart below displays the annual seasonal trend for unleaded gas futures. There are four periods highlighted - two bullish (green) and two bearish (red).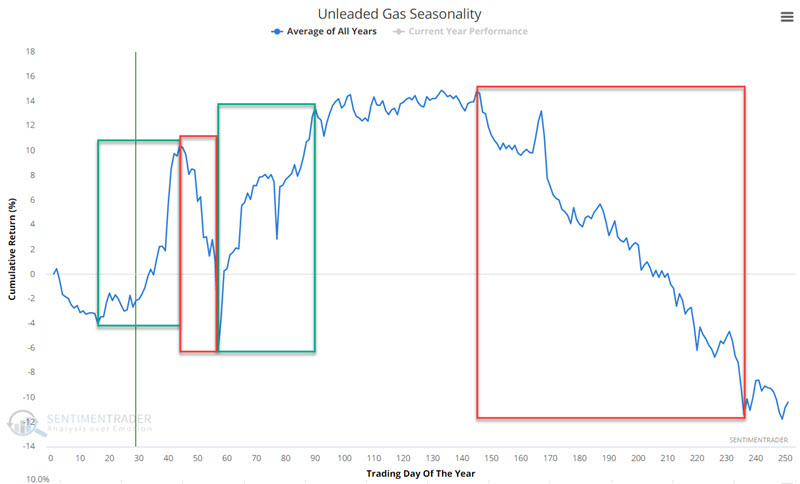
For each period highlighted in the chart above, we will look at the historical performance of unleaded gas futures from 10/3/2005 through 2/11/2022. Later we will look at results using an ETF alternative. For testing, we use a continuous type futures contract from Bloomberg with data starting in 2005.
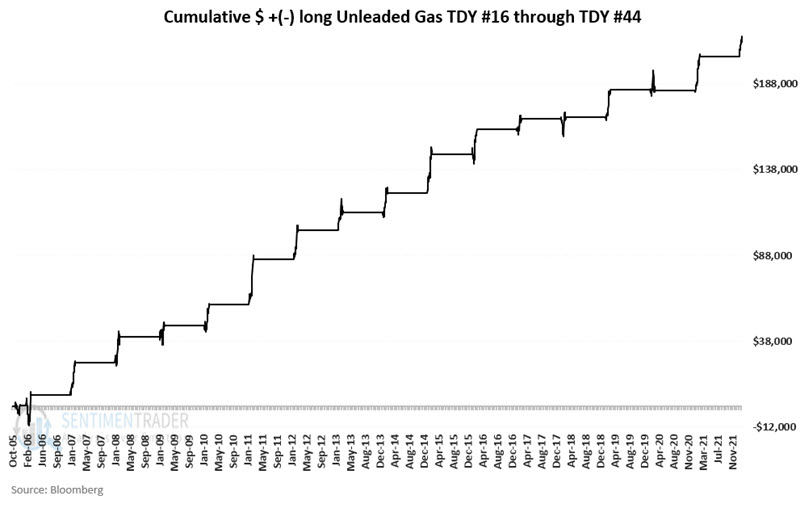
Period #1 (Favorable): TDY #16 through TDY #44
The first period to consider is the green box that extends from the trading day of the year (TDY) #16 through TDY #44. The chart below displays the cumulative $ gain/loss for unleaded gas futures if held long only during this period every year.
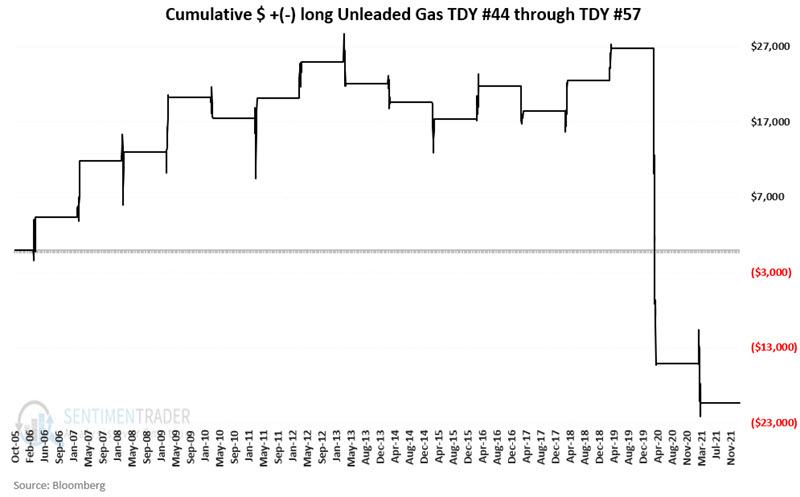
Period #2 (Unfavorable): TDY #44 through TDY #57
The second period to consider is the red box that extends from the trading day of the year (TDY) #44 through TDY #57. The chart below displays the cumulative $ gain/loss for unleaded gas futures if held long only during this period every year.
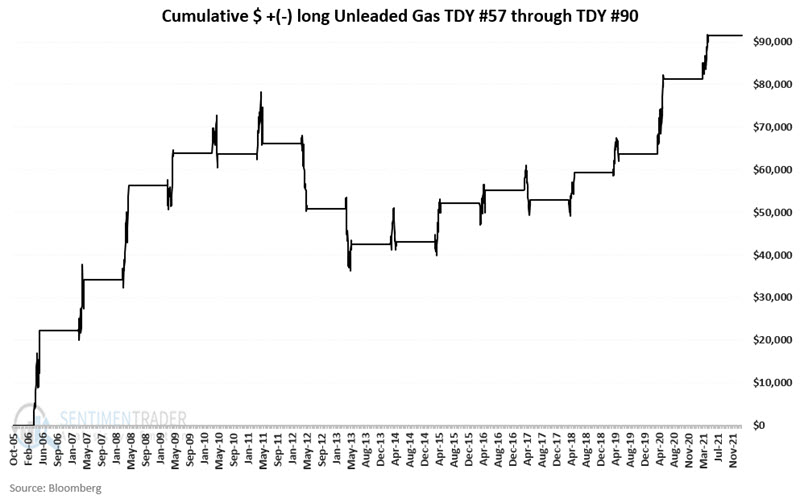
Period #3 (Favorable): TDY #57 through TDY #90
The third period to consider is the green box that extends from the trading day of the year (TDY) #57 through TDY #90. The chart below displays the cumulative $ gain/loss for unleaded gas futures if held long only during this period every year.
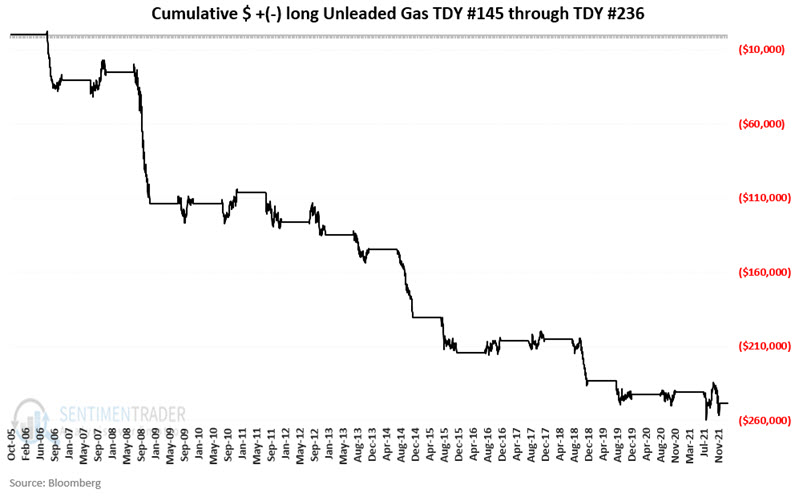
Period #4 (Favorable): TDY #145 through TDY #236
The last period to consider is the red box that extends from the trading day of the year (TDY) #145 through TDY #236. The chart below displays the cumulative $ gain/loss for unleaded gas futures if held long only during this period every year.
Combining favorable periods and unfavorable periods
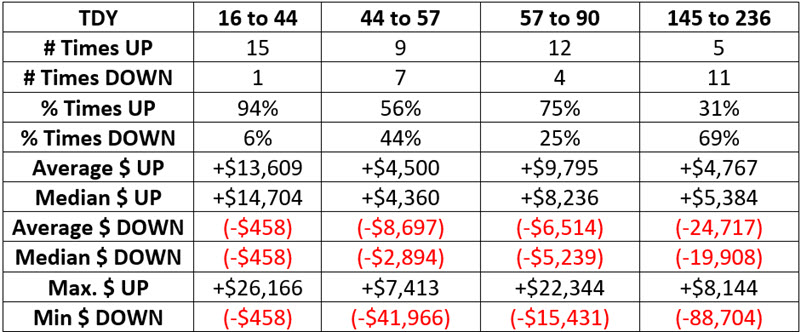
The table below displays the relevant facts and figures regarding performance during each of the four periods
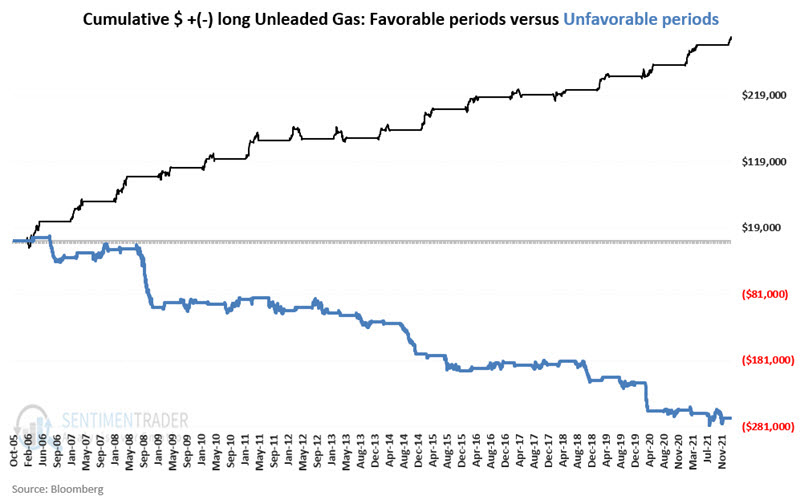
The chart below displays the cumulative hypothetical $ gain/loss achieved by holding a long position in unleaded gas futures during the two favorable periods (black line) versus the two unfavorable periods. The difference is stark.
An ETF Alternative: Ticker UGA
While the results above are compelling, the fact remains that most individuals will never trade an unleaded gas futures contract. Fortunately, there is an ETF alternative. The United States Gasoline Fund (ticker UGA) is a potentially useful tool for investors looking to participate in the movement of RBOB gasoline prices without the risks associated with trading futures contracts. Let's consider its performance during the bullish and bearish periods. Our test starts on 3/5/2008 and runs through 2/11/2022.
Period #1 (Favorable): TDY #16 through TDY #44
The chart below displays the growth of $1 invested in UGA only during TDY #16 through TDY #44.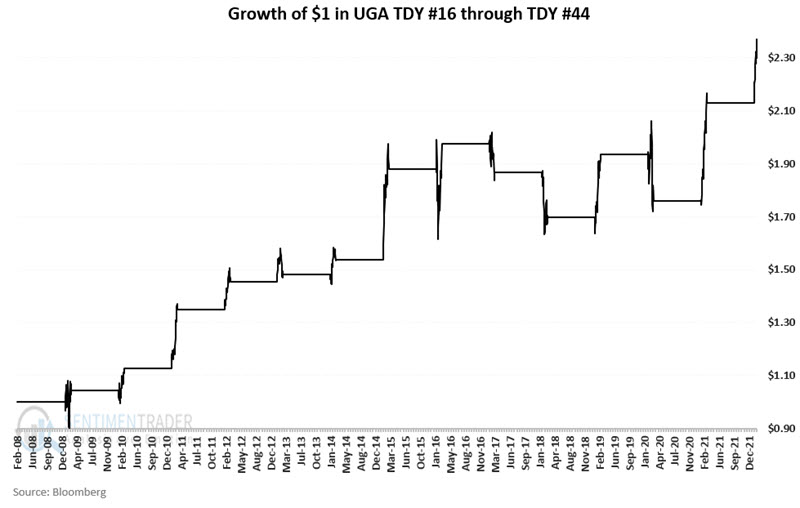
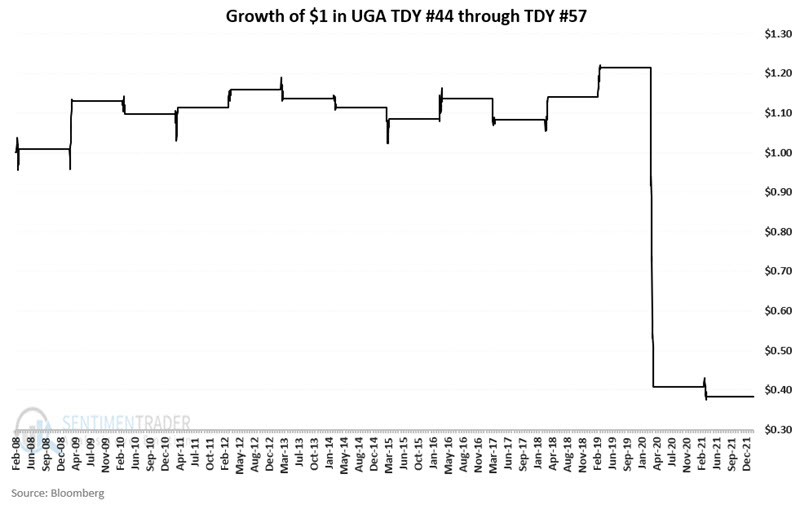
Period #2 (Unfavorable): TDY #44 through TDY #57
The chart below displays the growth of $1 invested in UGA only during TDY #44 through TDY #57.
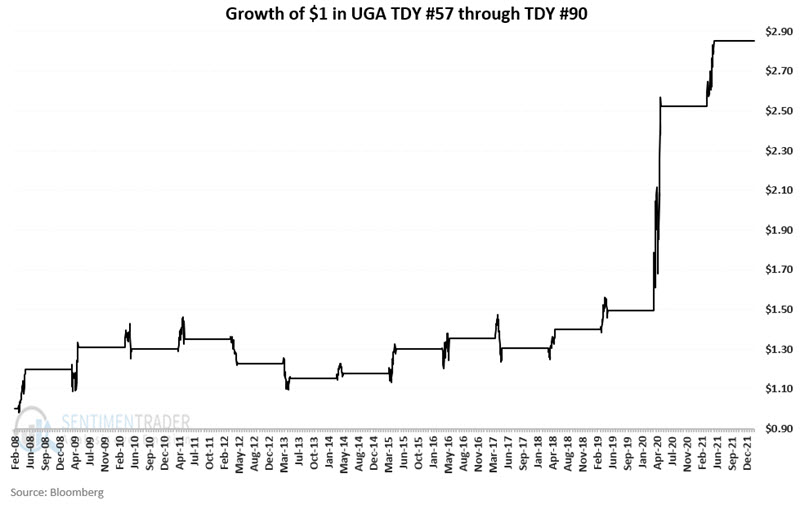
Period #3 (Favorable): TDY #57 through TDY #90
The chart below displays the growth of $1 invested in UGA only during TDY #57 through TDY #90.
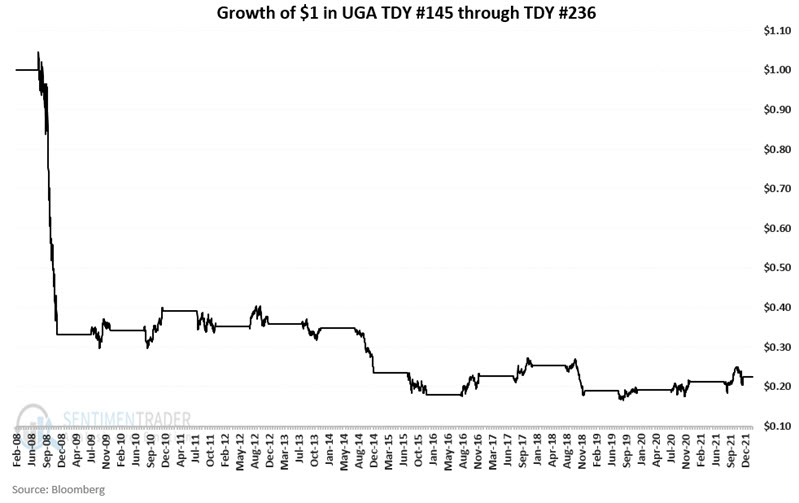
Period #4 (Unfavorable): TDY #145 through TDY #236
The chart below displays the growth of $1 invested in UGA only during TDY #145 through TDY #236.
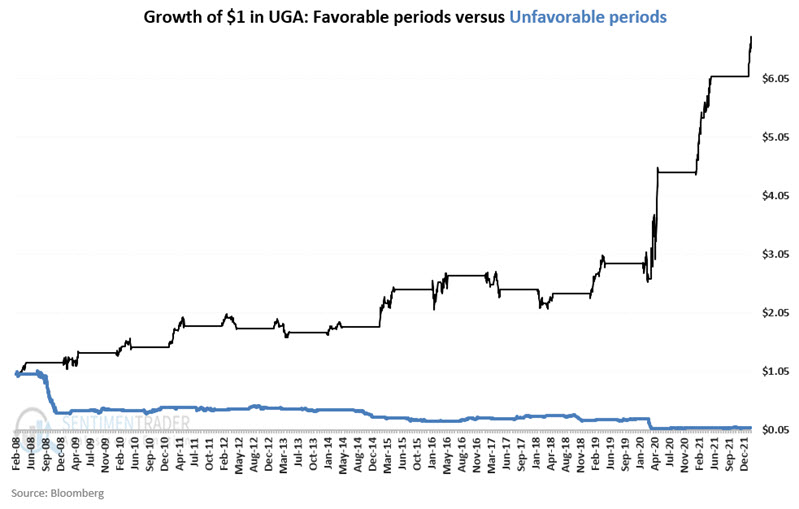
Combining favorable periods and unfavorable periods
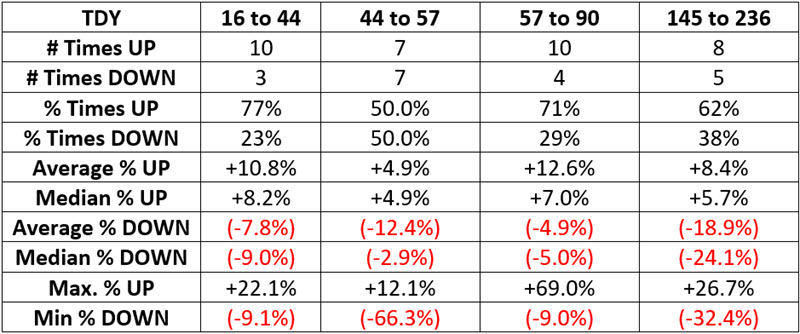
The table below displays the relevant facts and figures regarding performance during each of the four periods
The chart below displays the cumulative hypothetical growth of $1 achieved by holding a long position in unleaded gas futures during the two favorable periods (black line) versus the two unfavorable periods.
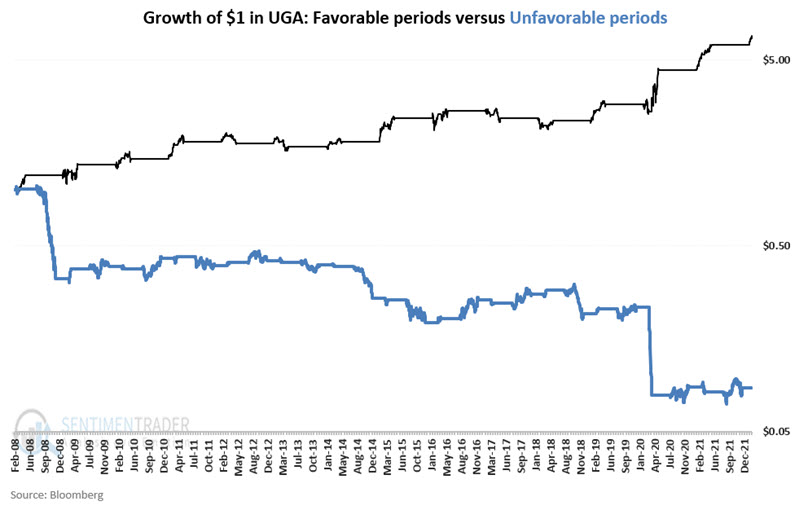
The chart below displays the same information as the chart above but on a logarithmic scale.
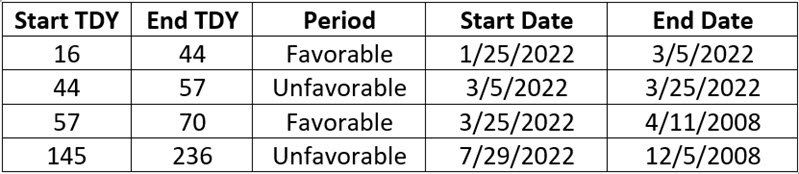
The 2022 periods
The table below displays the favorable and unfavorable periods for 2022.
What the research tells us…
The good news is that unleaded gas is a highly cyclical market. Knowledge of these cycles may help a trader timing when to be long, short, or flat gasoline. The bad news is that no cycle works every time. So beyond just timing, a trader must also make critically important decisions about capital allocation and risk management before they enter any trade. The other potential piece of good news is that UGA offers non-futures traders to trade this important commodity market just as they would shares of stock.