Seasonal opportunities forming in stock sectors, bonds, and energy

Key points
- Seasonality can be especially helpful in deciding when and where to allocate capital
- The housing and real estate sectors are in or are nearing favorable seasonal periods; the same is true for high-yield and investment-grade corporate bonds
- Meanwhile, the potential for trouble looms in the energy sector if price action weakens from here
Housing sector enters the seasonal sweet spot
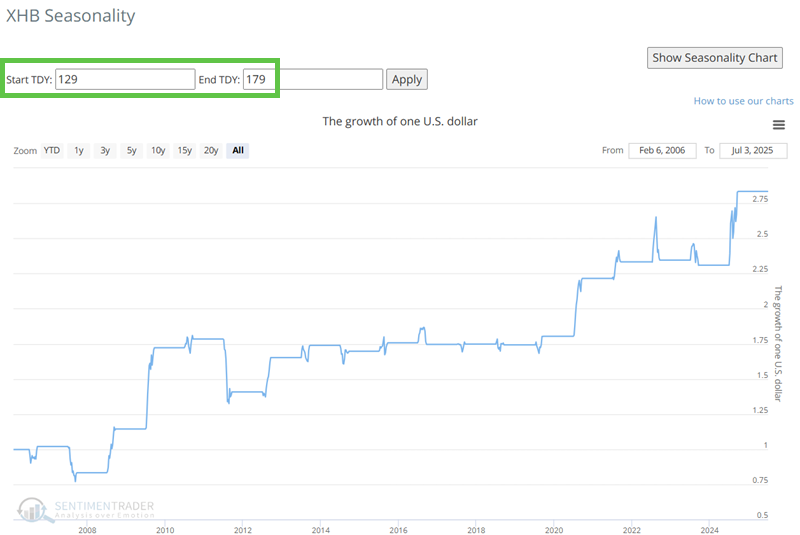
The Annual Seasonal Trend chart below for the SPDR S&P Homebuilders ETF (XHB) shows a favorable period that extends from the close of Trading Day of the Year (TDY) #129 through TDY #179. For 2025, this period extends from the close on 2025-07-10 through 2025-09-19.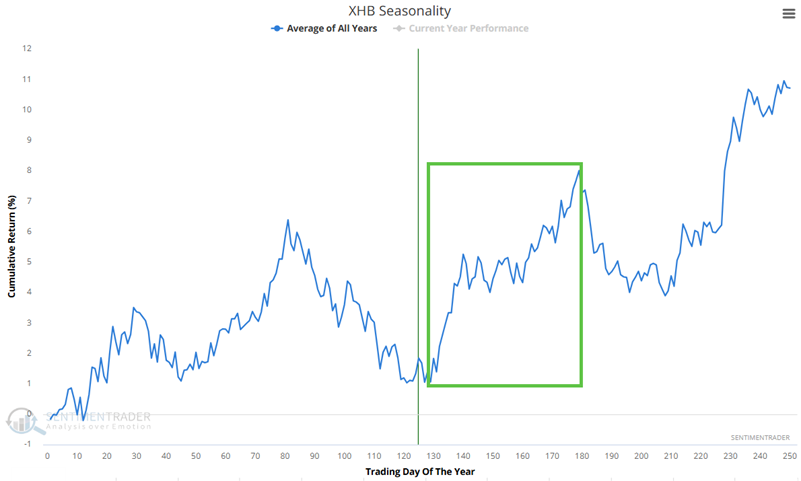 The chart below displays the hypothetical growth of $1 invested in XLB only during this period, every year since 2006.
Currently, XHB's price action agrees with the favorable seasonal trend. As long as price and seasonality agree, traders can look to play the long side of this sector during the favorable seasonal window.
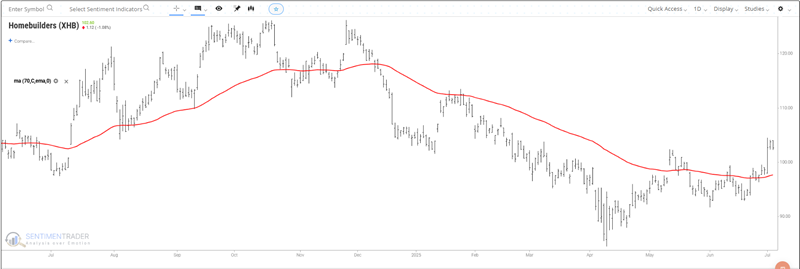
For the record, there is nothing "magical" about a 70-day EMA. However, it tends to be a helpful filter for designating price action to agree or disagree with seasonality. Ideally, a trader will consider a bullish position if seasonality and price action are both favorable, and/or a bearish position if seasonality and price action are both unfavorable.
A favorable time for real estate
In this note dated 2025-05-21, we highlighted the real estate sector as a potential seasonal play. Since then, the iShares U.S. Real Estate ETF (IYR) has bounced roughly 3.5% and established a slightly favorable price trend.
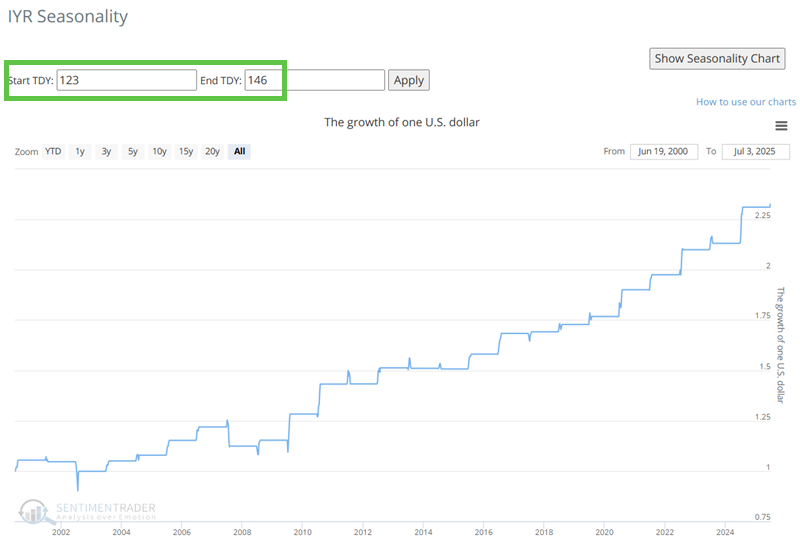
The Annual Seasonal Trend chart below for the iShares U.S. Real Estate ETF (IYR) shows a continued favorable period that extends from the close of Trading Day of the Year (TDY) #123 through TDY #146. For 2025, this period extends from the close on 2025-07-01 through 2025-08-04.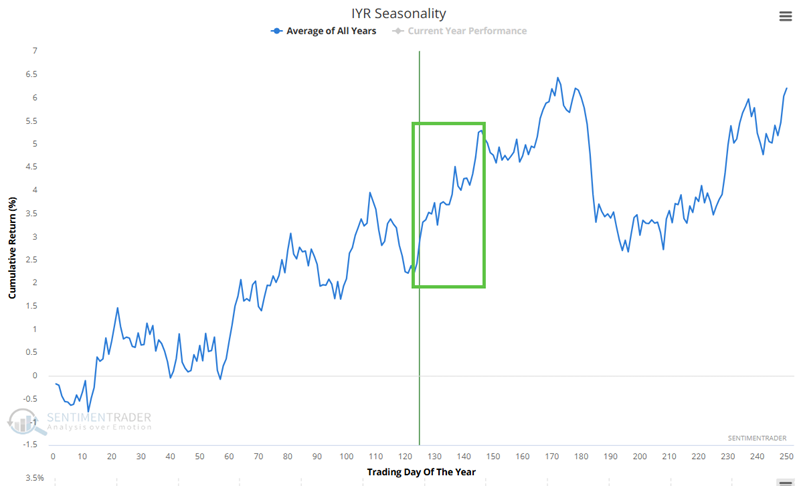 The chart below displays the hypothetical growth of $1 invested in IYR only during this period, every year since 2000.
Price action has improved for IYR as shown in the chart below.
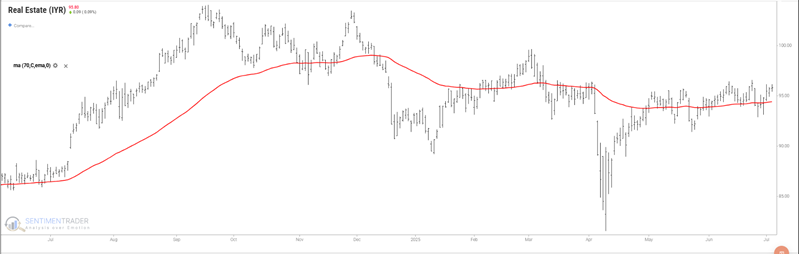
As long as price and seasonality agree, real estate could continue to surprise to the upside. Now let's focus on some potential plays in the bond market.
A short favorable window for high-yield bonds
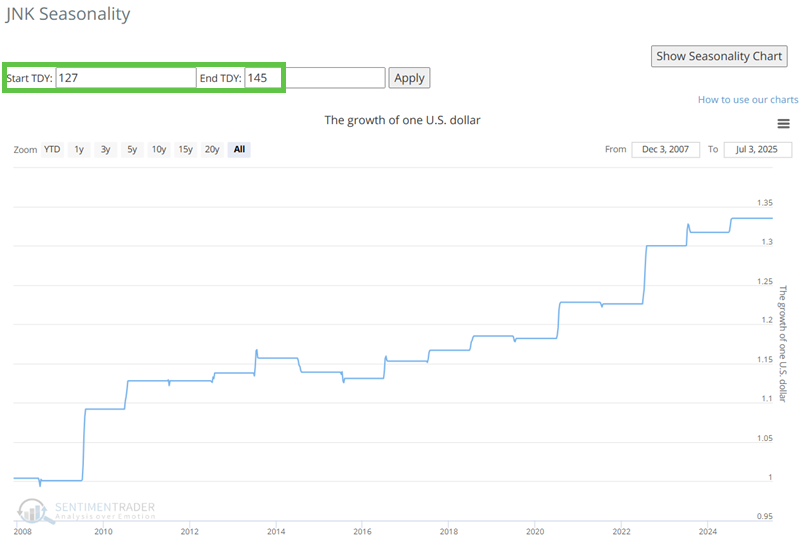
The Annual Seasonal Trend chart below for the SPDR Bloomberg High Yield Bond ETF (JNK) shows a short favorable seasonal window in the weeks ahead. This period extends from the close of Trading Day of the Year (TDY) #127 through TDY #145. For 2025, this period extends from the close on 2025-07-08 through 2025-08-01.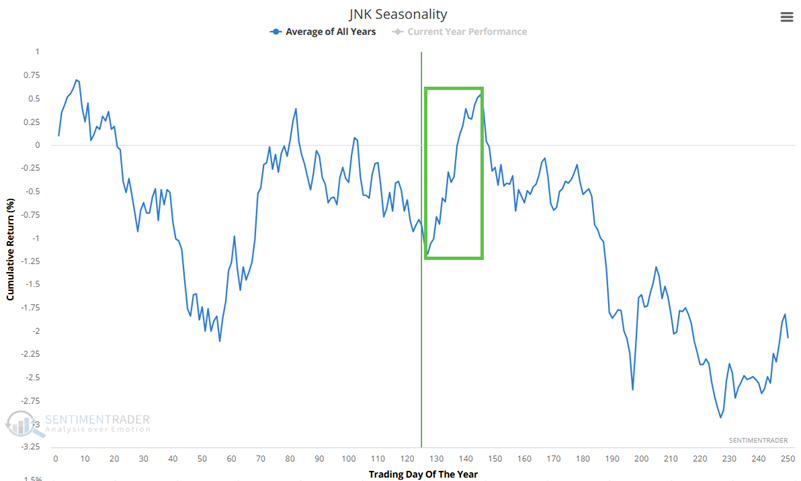 The chart below displays the hypothetical growth of $1 invested in JNK only during this period, every year since 2008.
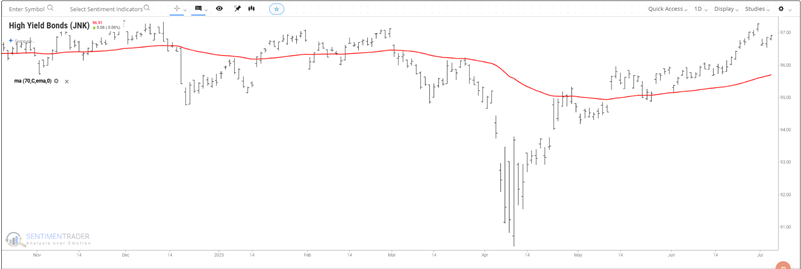
The chart below shows that price action can be deemed favorable for JNK. Alternative tickers for consideration are HYG andANGL.
Corporate bonds may finally be ready to "bounce"
When most people think of "trading opportunities," corporate bonds rarely come to mind. But as an old saying goes, "Opportunity is where you find it." The bond market in general has traded sideways to lower for over four years. Many investors and traders have "thrown in the towel." For the record, my own long-term bond "investment" model remains solidly unfavorable. However, an opportunity to play the long side may be forming for shorter-term traders.
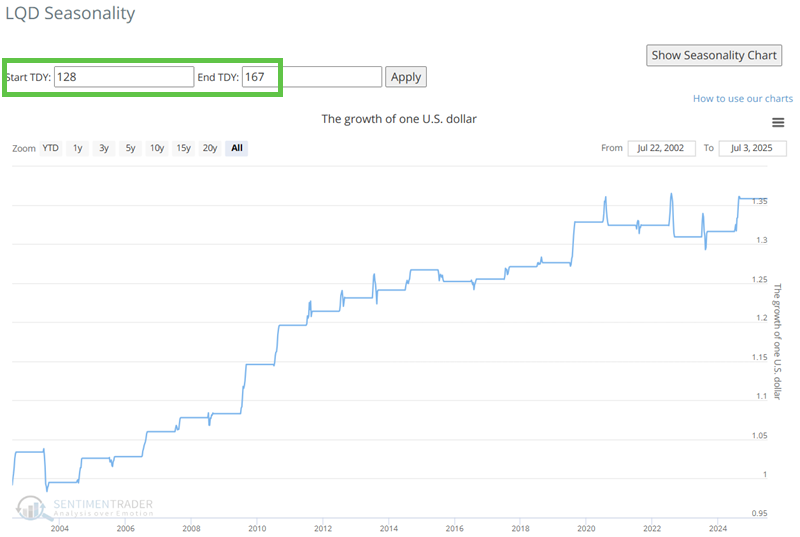
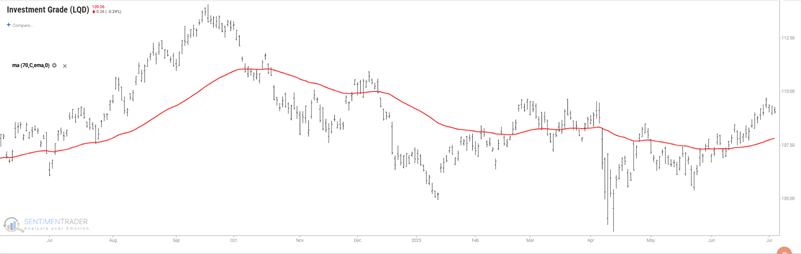
The Annual Seasonal Trend chart below for the iShares iBoxx $ Inv Grade Corporate Bond ETF (ticker LQD) shows an impending favorable seasonal window. This period extends from the close of Trading Day of the Year (TDY) #128 through TDY #167. For 2025, this period extends from the close on 2025-07-09 through 2025-09-03.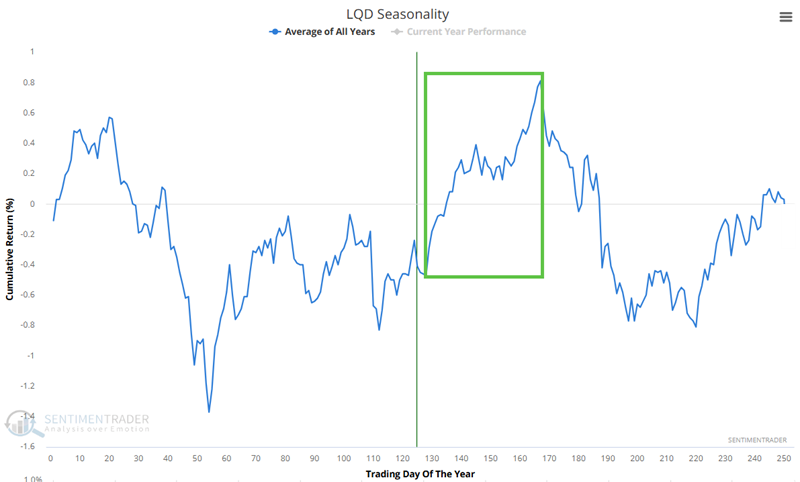 The chart below displays the hypothetical growth of $1 invested in LQD only during this period, every year since 2003.
The chart below shows that price action can be deemed favorable for LQD.
A potential for trouble in the energy sector
The Annual Seasonal Trend chart below for the United States Oil Fund LP ETF (ticker USO) shows an unfavorable period that extends from the close of Trading Day of the Year (TDY) #125 through TDY #160. For 2025, this period extends from the close on 2025-07-03 through 2025-08-22.
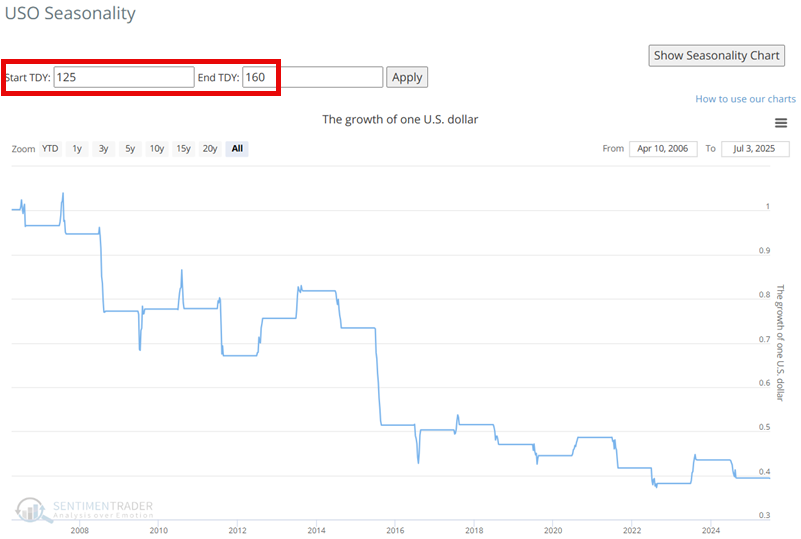
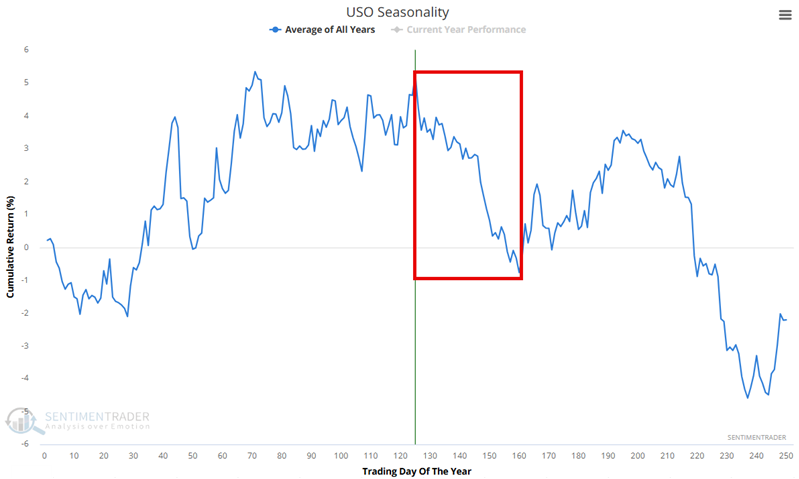 The chart below displays the hypothetical growth of $1 invested in USO only during this period, every year since 2006.
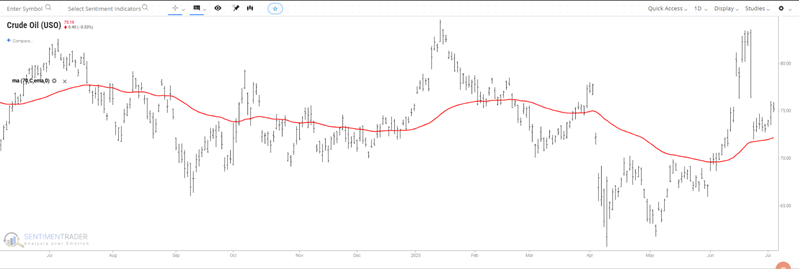
Note that at the moment, price action for USO is ostensibly favorable (i.e., price is above a rising 70-day exponential moving average). A breakdown in price action would signal an opportunity to play the short side in USO.
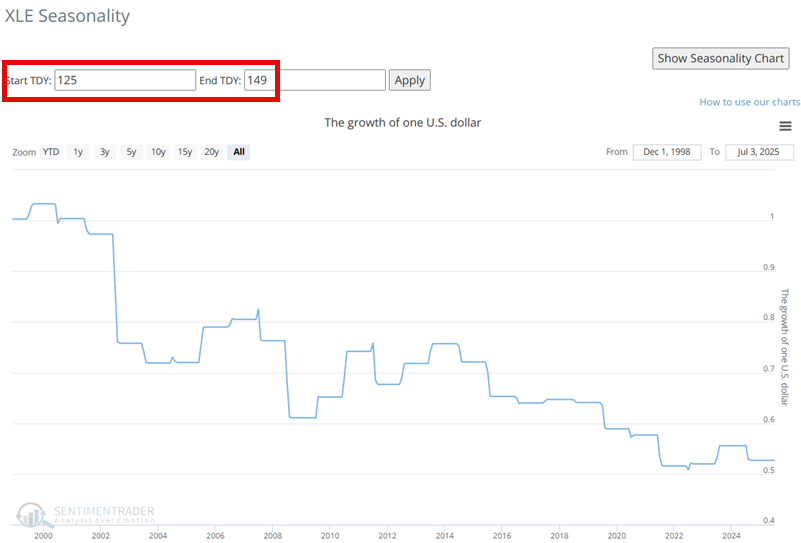
If we look at the broader energy sector for stocks, the chart below shows an unfavorable period for the Energy Select Sector SPDR Fund ETF (ticker XLE) that extends from the close of Trading Day of the Year (TDY) #125 through TDY #149. For 2025, this period extends from the close on 2025-07-03 through 2025-08-07.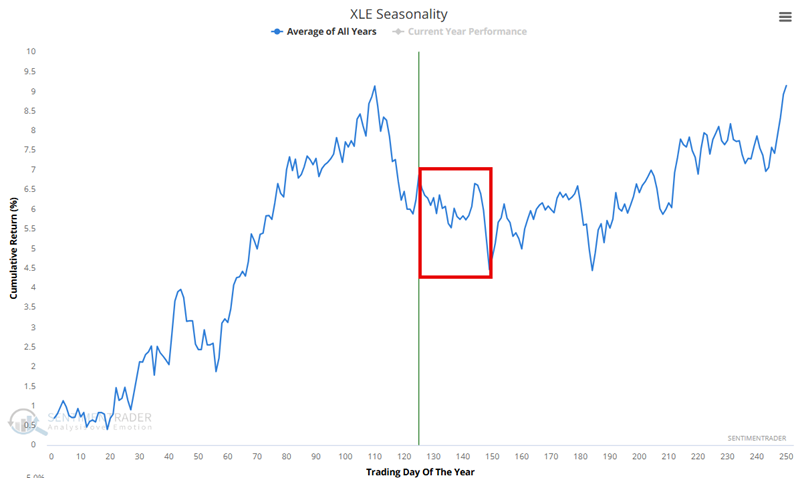
The chart below displays the hypothetical growth of $1 invested in XLE only during this period, every year since 1999.
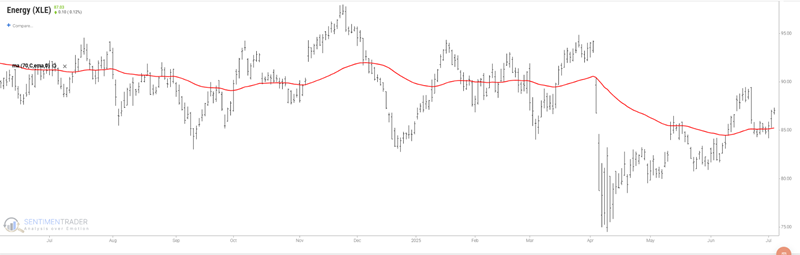
Note that at the moment, price action for XLE is ostensibly favorable (i.e., price is above a rising moving average). A breakdown in price action would signal an opportunity to play the short side in XLE.
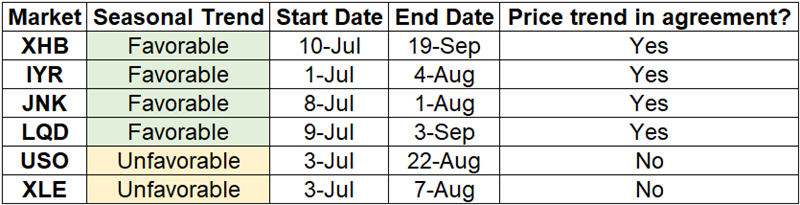
What the research tells us…
Seasonality is merely a summation of the past, NOT a roadmap to the future. Per Michael Santoli's famous quote, "Seasonality is climate, not weather." For my purposes, I use seasonality to tell me "when to look where." I also tend to prefer to pursue opportunities where price and seasonal trends agree. The table below summarizes the details above, showing the market, the seasonal direction and dates, and whether or not the price is presently in agreement with the impending seasonal trend.