
Seasonal good, seasonal bad

Key Points
- Corn futures have enjoyed a terrific run so far in 2022. If history is a guide, there may still be room to run
- Homebuilders have been under pressure for most of 2022. This is not likely to change anytime soon if history is a guide.
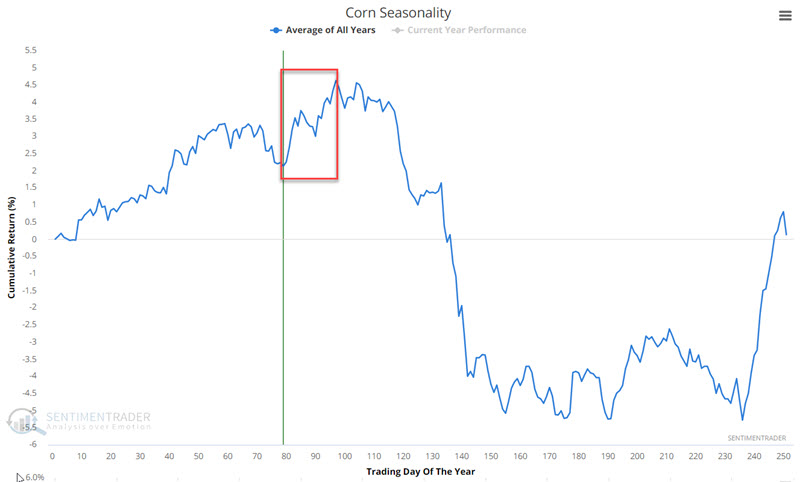
A seasonally favorable period for corn
The chart below displays the annual seasonal trend for corn futures. Note that corn is presently in a favorable period that extends from the trading day of the year #79 through the trading day of the year #97. For 2022, this period began on 4/27 and extends through 5/20.
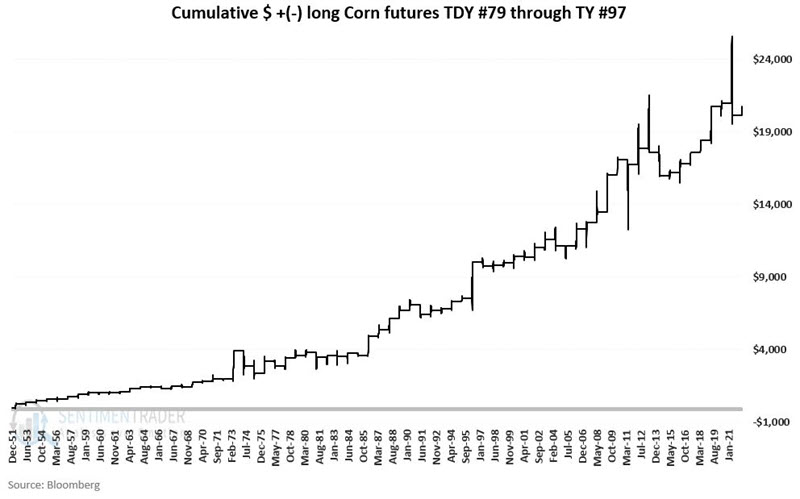
The chart below displays the hypothetical cumulative $ +(-) achieved by holding long a corn futures contract from TDY #79 through TDY +97 every year since 1952.
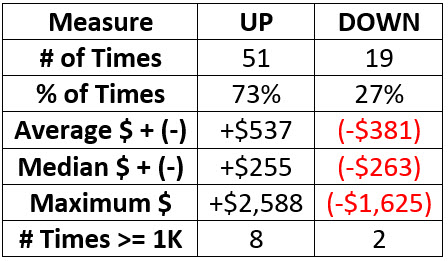
The table below displays a summary of performance results.
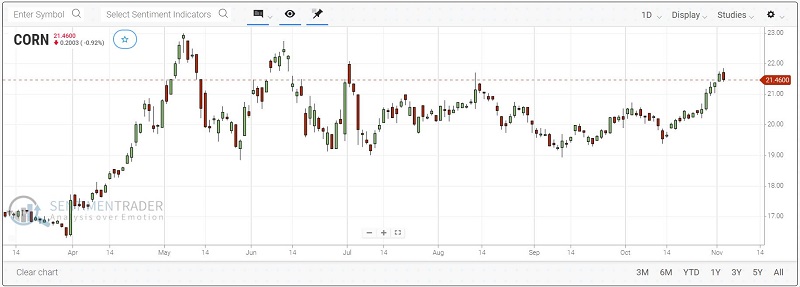
Traders who do not want to trade futures contracts can consider buying shares of CORN (Teucrium Corn ETF) as an alternative.
A seasonally unfavorable period for homebuilding stocks
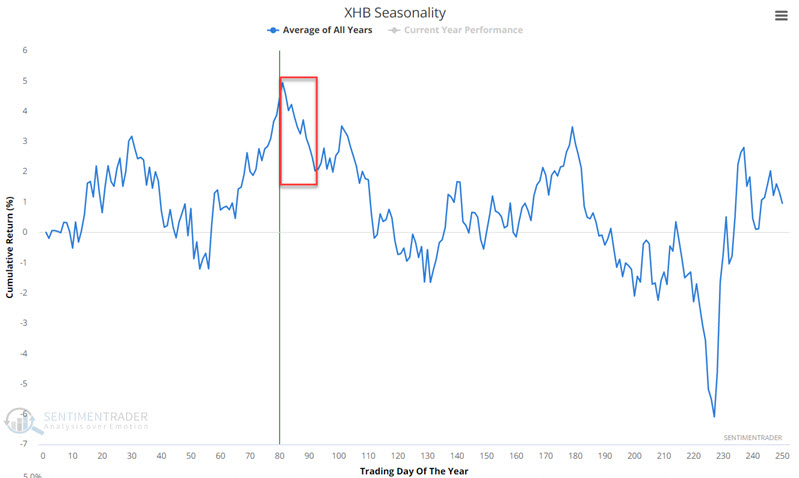
The chart below displays the annual seasonal trend for ticker (XHB). Note that XHB is entering an unfavorable period extending from the trading day of year #81 through year #92. For 2022, this period begins at the close on 4/28 and extends through 5/13.
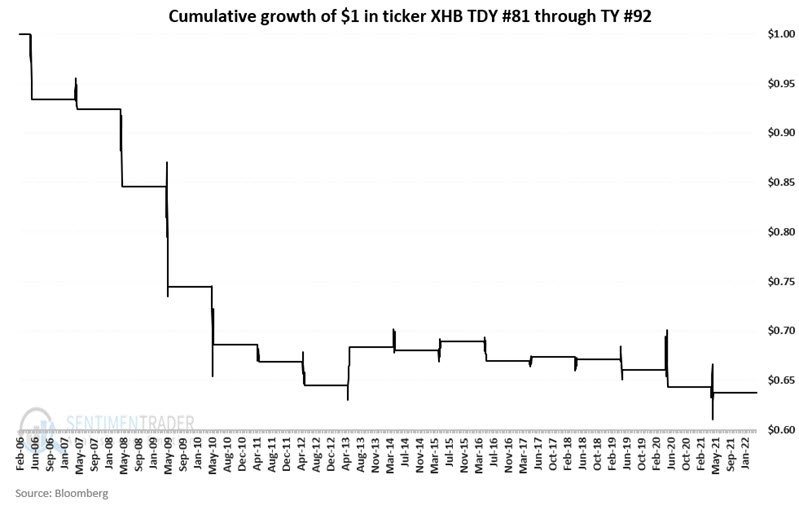
The chart below displays the hypothetical cumulative $ +(-) achieved by holding a long position in ticker XHB from TDY #81 through TDY #92 each year since XHB started trading in 2006.
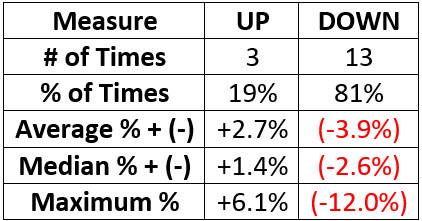
The table below displays a summary of performance results.
XHB has been quite weak in 2022. This seasonal trend suggests additional weakness in the near term.
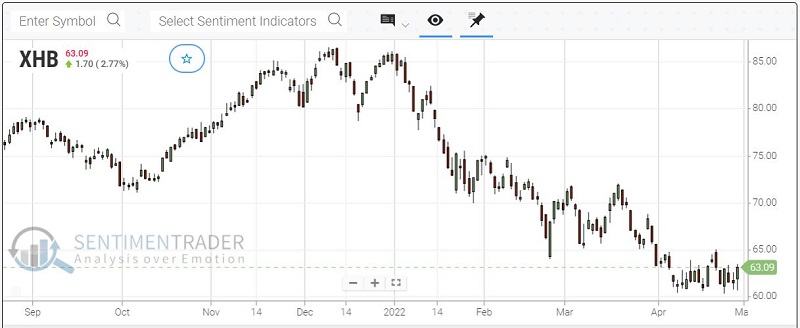
One key to trading success is putting the odds on your side as much as possible when configuring a trade. While there are never any guarantees, the current configuration of price and seasonal trends suggests that, at the very least, traders should hold off on trying to pick a bottom in homebuilders until at least the middle of next month.
What the research tells us…
Relying solely on a short-term seasonal trend to initiate a trade requires a relatively large leap of faith. However, when price action is trending in line with a currently active seasonal trend, the odds of success tend to increase. With corn in an established uptrend and housing stocks in an established downtrend, the latest seasonal trends may offer an opportunity to short-term traders.