Products
SentimenTrader Trading Tools
‍
Backtest Engine
My Trading Toolkit
Correlation Analysis
Seasonality
Indicators & Data API
‍
Proprietary Indicators & Charts
Market Data API
Strategies & Scanner
‍
50+ Trading Strategies
Smart Stock Scanner
Research Reports
‍
Research Solutions
Reports Library
Free Resources
Simple Backtest Calculator
Simple Seasonality Calculator
The Kelly Criterion Calculator
Sentiment Geo Map
Public Research Reports
Pricing
Company
About
In the News
Testimonials
Client Success Stories
Contact
Log inLoginSign up
< BACK TO ALL REPORTS

Searching for The Summer Rally

Jay Kaeppel
2021-06-23
The supposed "Summer Rally" in the stock market is one of those adages thrown around but rarely defined. So, let's take a closer look at the stock market's performance during the summer months of June, July, and August as a whole, and also at two specific "favorable" and "unfavorable" periods.

The supposed "Summer Rally" in the stock market is one of those adages thrown around but rarely defined.  This piece takes a closer look at the stock market's performance during the summer months of June, July, and August as a whole, and also at two specific "favorable" and "unfavorable" periods.

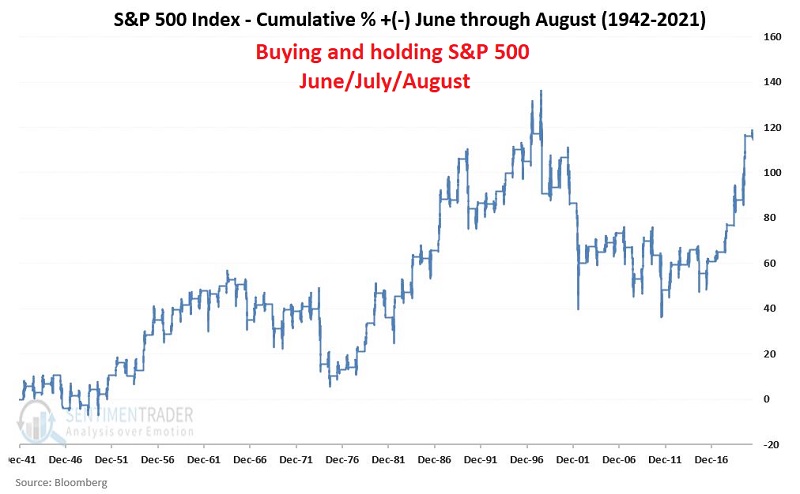
S&P 500 PERFORMANCE JUNE THROUGH AUGUST

The chart below displays the cumulative price return for the S&P 500 Index if held long ONLY during June, July, and August, every year starting in 1942 through June 18, 2021.

For the record:

  • June through August cumulative % +(-) = +114%
  • All other months cumulative % +(-) = +22,275%

While the stock market has shown a positive overall performance during the summer months, clearly, these months have not been the most dynamic time of year for the stock market over the past eight decades.

Now let's focus on breaking the three summer months into two "favorable" and "unfavorable" periods.

THE SUMMER MONTH "FAVORABLE PERIODS"

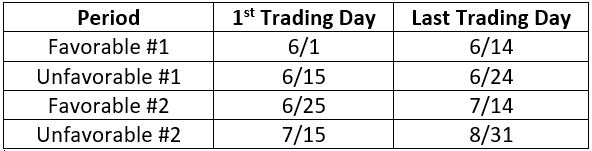
Favorable Summer Periods:

  • Favorable Period #1: June Trading Day #1 through June Trading Day #10
  • Favorable Period #2: June Trading Day #19 through July Trading Day #9

The chart below displays the cumulative % price change for the S&P 500 Index during Favorable Period #1 since 1941.

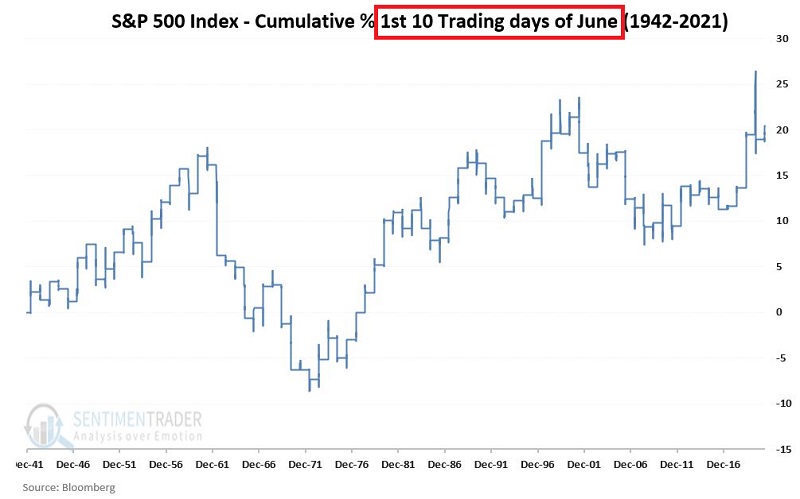
The cumulative price gain during Favorable Period #1 is +21%.

The chart below displays the cumulative % price change for the S&P 500 Index during Favorable Period #2 since 1941.

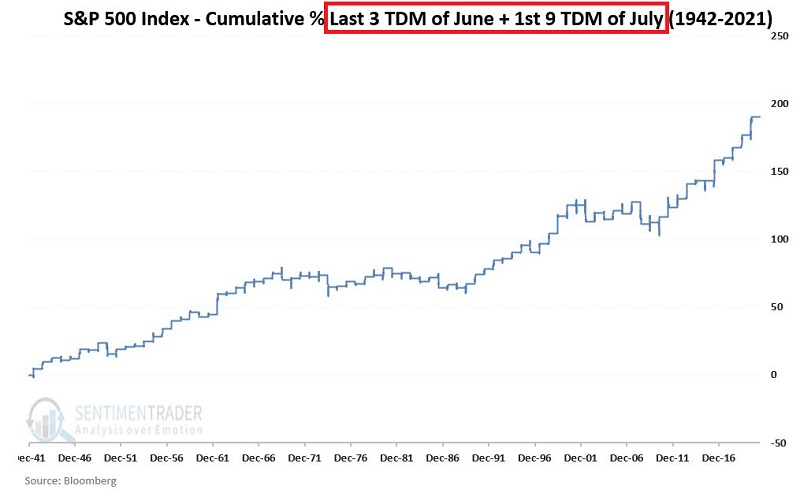
The cumulative price gain during Favorable Period #2 is +190%.

THE SUMMER MONTH "UNFAVORABLE PERIODS"

Unfavorable Summer Periods:

  • Unfavorable Period #1: June Trading Day #11 through June Trading Day #18
  • Unfavorable Period #2: July Trading Day #10 through the end of August

The chart below displays the cumulative % price change for the S&P 500 Index during Unfavorable Period #1 since 1941.

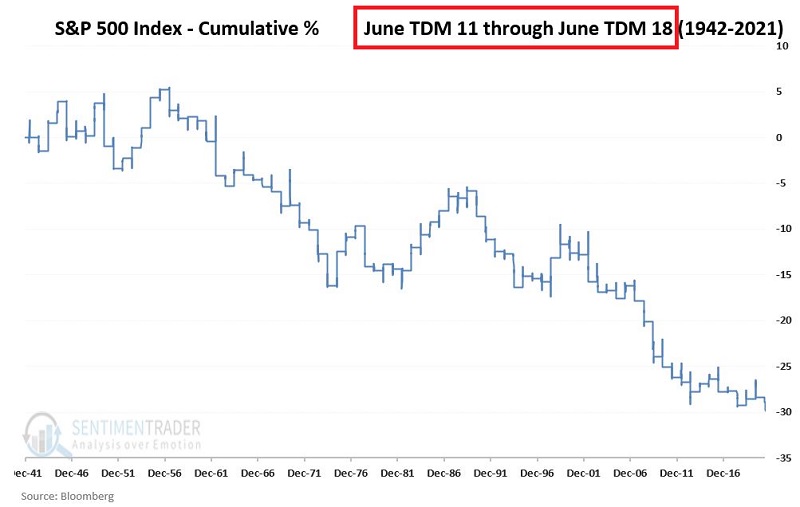
The cumulative price decline during Unfavorable Period #1 is -30%.

The chart below displays the cumulative % price change for the S&P 500 Index during Unfavorable Period #2 since 1941.

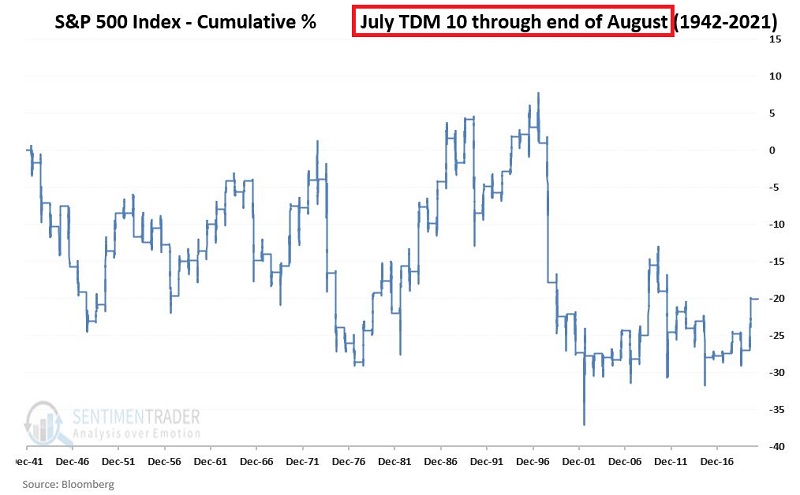
The cumulative price decline during Unfavorable Period #2 is -20%.

COMBINING PERIODS

Now we will make the following assumption:

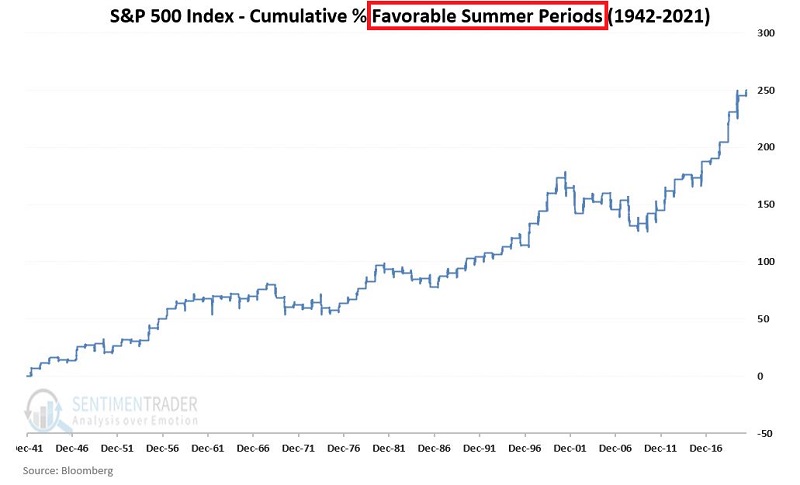
  • Trader A bought and held the S&P 500 Index ONLY during the two Favorable summer periods each year since 1942
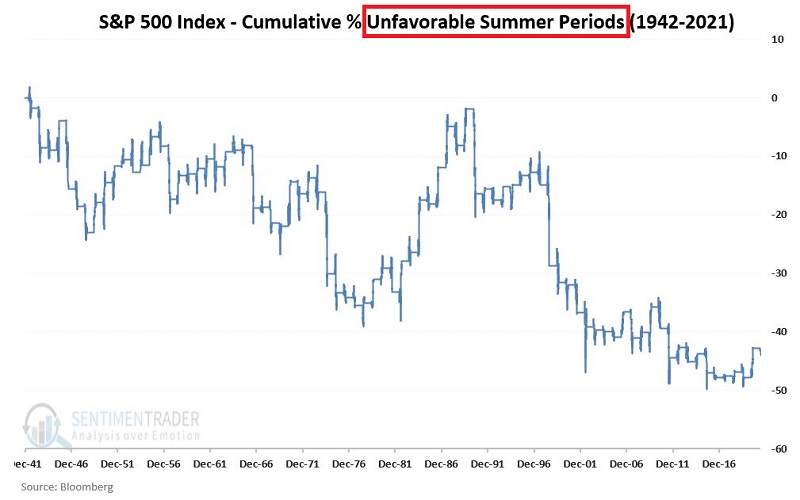
  • Trader B bought and held the S&P 500 Index ONLY during the two Unfavorable summer periods each year since 1942

The cumulative hypothetical returns for Trader A appear in the chart below.

The cumulative hypothetical returns for Trader B appear in the chart below.

The comparison of cumulative returns appears in the table below.

SUMMARY

Nothing in the markets is ever perfect. The best we can hope for is long-term consistency. The chart below:

  • Divides the growth of $1,000 invested in the S&P 500 ONLY during the two Favorable summer periods
  • By the growth of $1,000 invested in the S&P 500 ONLY during the two Unfavorable summer periods

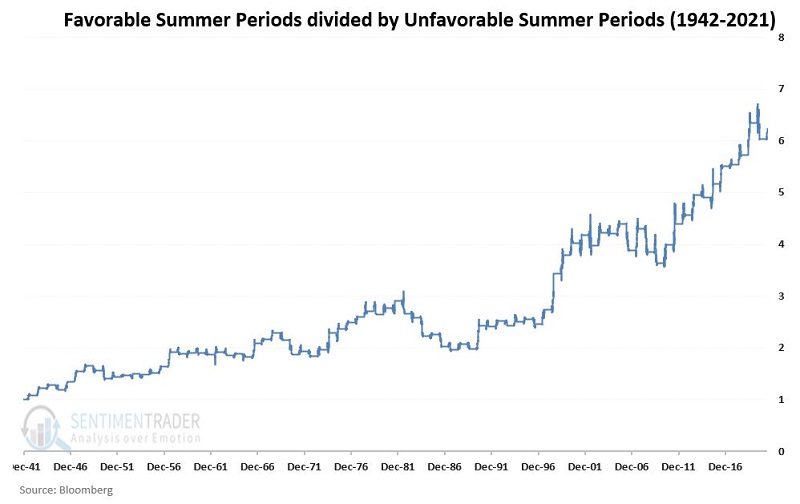
The chart above falls firmly into the "not perfect, but typically trending in the right direction" category over the past 80 years.

The table below displays the favorable and unfavorable periods for Summer 2021.


Sorry, you don't have access to this report

Upgrade your subscription plan to get access
Go to Dasboard
PRODUCTS
SentimenTrader
Trading Tools
Indicators & Data API
‍
Strategies & Scanner
‍
Research Reports
FREE
RESOUrCES
Simple Backtest
Calculator
Simple Seasonality
Calculator
The Kelly Criterion
Calculator
Sentiment Geo Map
‍
Public Research Reports
‍
Pricing
Bundle pricing
‍
Announcements
‍
FAQ
COMPANY
‍
About
‍
In the News
‍
Testimonials
‍
Client Success Stories
CONTACT
‍
General Inquiries
‍
Media Inquiries
‍
Financial Professionals Inquiries
‍
© 2025 Sundial Capital Research Inc. All rights reserved.
Setsail Marketing
TermsPrivacyAffiliate Program
Risk Disclosure: Futures and forex trading contains substantial risk and is not for every investor. An investor could potentially lose all or more than the initial investment. Risk capital is money that can be lost without jeopardizing ones’ financial security or life style. Only risk capital should be used for trading and only those with sufficient risk capital should consider trading. Past performance is not necessarily indicative of future results.

Hypothetical Performance Disclosure: Hypothetical performance results have many inherent limitations, some of which are described below. No representation is being made that any account will or is likely to achieve profits or losses similar to those shown; in fact, there are frequently sharp differences between hypothetical performance results and the actual results subsequently achieved by any particular trading program. One of the limitations of hypothetical performance results is that they are generally prepared with the benefit of hindsight. In addition, hypothetical trading does not involve financial risk, and no hypothetical trading record can completely account for the impact of financial risk of actual trading. for example, the ability to withstand losses or to adhere to a particular trading program in spite of trading losses are material points which can also adversely affect actual trading results. There are numerous other factors related to the markets in general or to the implementation of any specific trading program which cannot be fully accounted for in the preparation of hypothetical performance results and all which can adversely affect trading results.

Testimonial Disclosure: Testimonials appearing on this website may not be representative of other clients or customers and is not a guarantee of future performance or success.