
Risk-On Relative Ratio Update

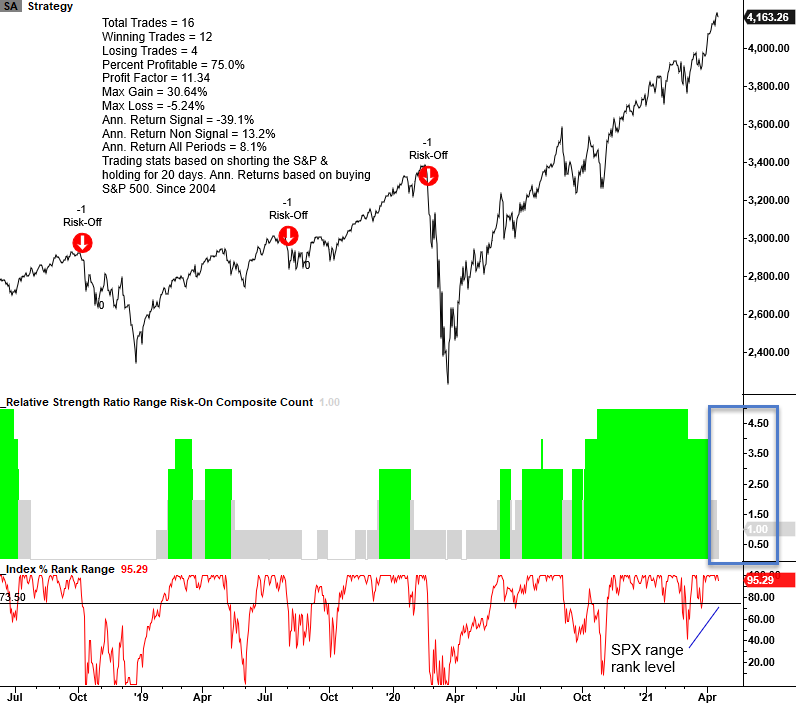
The relative strength ratio range risk-on composite model count has now fallen to one, with the copper to gold ratio rank as the only component above the 75th percentile. Remember, this level controls the composite count. The model generates a signal when the count falls to one or less and the S&P 500 crosses below a user-defined range rank level. As I write this note, the real-time range rank for the S&P 500 currently stands at 88%. Therefore, it's unlikely that a signal occurs on the close unless the market deteriorates in a meaningful way.
As always, I like to use a weight-of-the-evidence approach to manage risk. I will be monitoring several other risk-off models for potential warning signs.
Please see my note from 1/19/21 for more comprehensive details on the relative strength ratio range risk-on composite model. You can also monitor the relative ratio ranks for the component relationships on the website. Please click here.
Relative Ratio Range Rank Composite
Data as of 4/19/21 close.
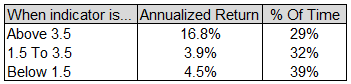
Composite Count Level Annualized Returns
The following table provides annualized returns for the relative strength ratio range risk-on composite count. As one can see, the returns are less robust when the risk-on groups are underperforming the market as measured by the model.
Relative Ratio Range Ranks
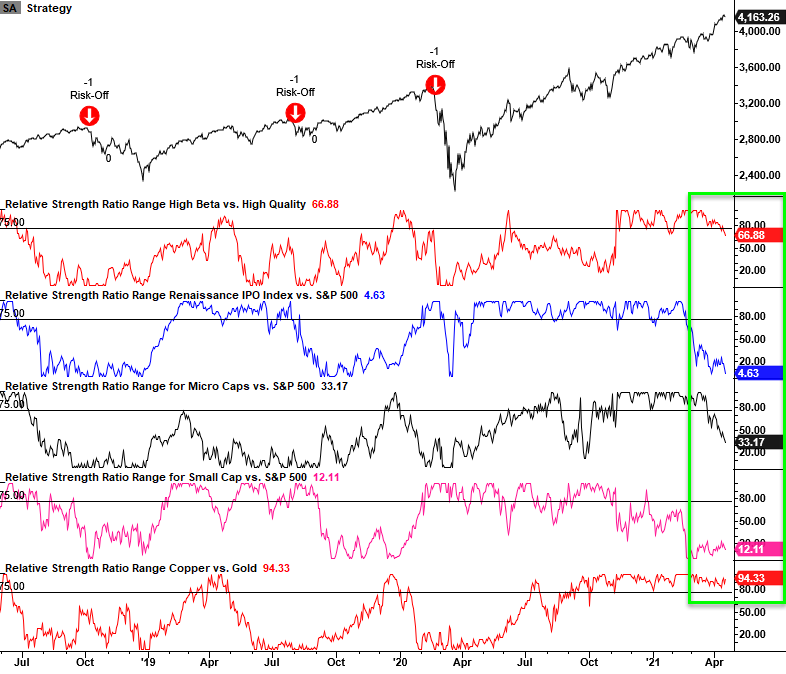
Conclusion: The risk-on relative ratio measures have been under pressure, and the model is on the cusp of a risk-off signal should the S&P 500 deteriorate further from current levels. The transition away from more risky pockets of the market does not always spell doom and gloom as other groups can lead the market.