Data &
Technology
Research
Reports
Report Solutions
Reports Library
Actionable
Strategies
Free
Resources
Simple Backtest Calculator
Simple Seasonality Calculator
The Kelly Criterion Calculator
Sentiment Geo Map
Public Research Reports
Free Webinar
Pricing
Company
About
Meet Our Team
In the News
Testimonials
Client Success Stories
Contact
Log inLoginSign up
< BACK TO ALL REPORTS

Risk-on behavior is nearing record levels

Jason Goepfert
2021-03-15
In aggregate, some of our most consistent and broad-based indicators are showing that investors are still in risk-on mode. The biggest danger is that risk-on behavior has been at a very high level for a prolonged period, which has preceded consistently poor returns.

The new Risk-On / Risk-Off Spotlight page shows that most of the core indicators are still in risk-on mode. As long as that's the case, investors tend to be in buy-the-dip mode, which we saw again last week.

Like many other positive developments we've looked at over the last month or two, the biggest caveat is simply that the environment has been so positive for so long.

By the end of last week, nearly 100% of the indicators were in risk-on mode. That's so high that it has preceded weak returns. We should generally expect prices to rise when behavior is showing a risk-on mode. But when it gets above 80%, the S&P's annualized return was -0.1% and above 90% it was -1.7%.

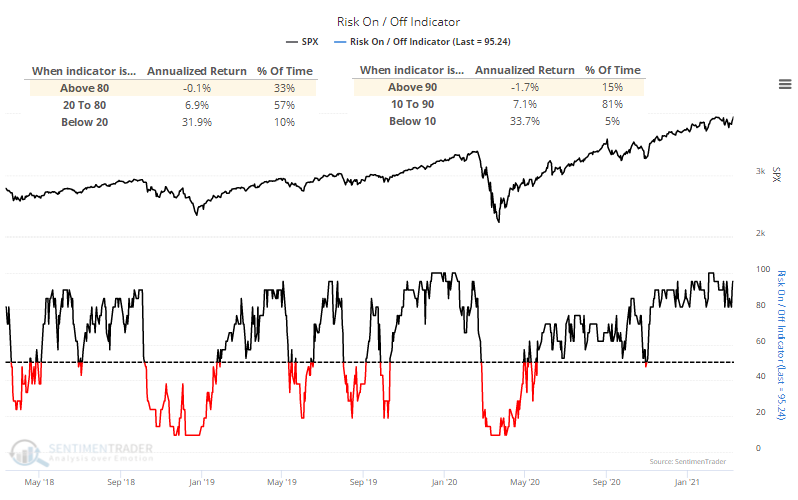
A risk-on mentality has been so prevalent for such a prolonged period that the 50-day average of the aggregate indicator has climbed above 90.5%, meaning that an average day over the past 50 sessions has seen more than 90% of the indicators displaying risk-on behavior.

The Backtest Engine shows us that when the 50-day average has been this high, future returns were poor. Out of 162 days that met the criteria, only 50 of them showed a positive return 3 months later. To run this test, click here and then the Run Backtest button. Premium users will be able to test the full history, dating back to 2000. 

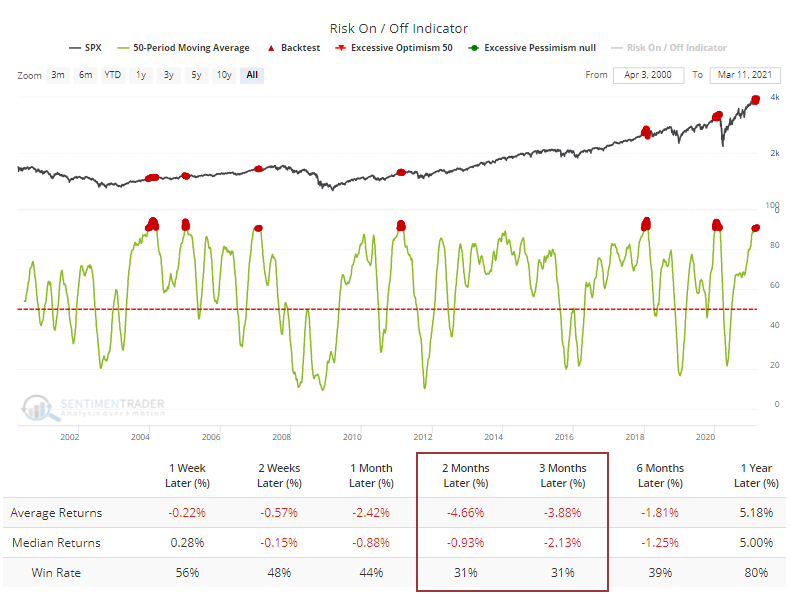
Higher-beta indexes like the Nasdaq Composite fared even worse. Using that index in the Backtest Engine, the median 3-month return was -3.9% with only a 24% probability of seeing a positive return.

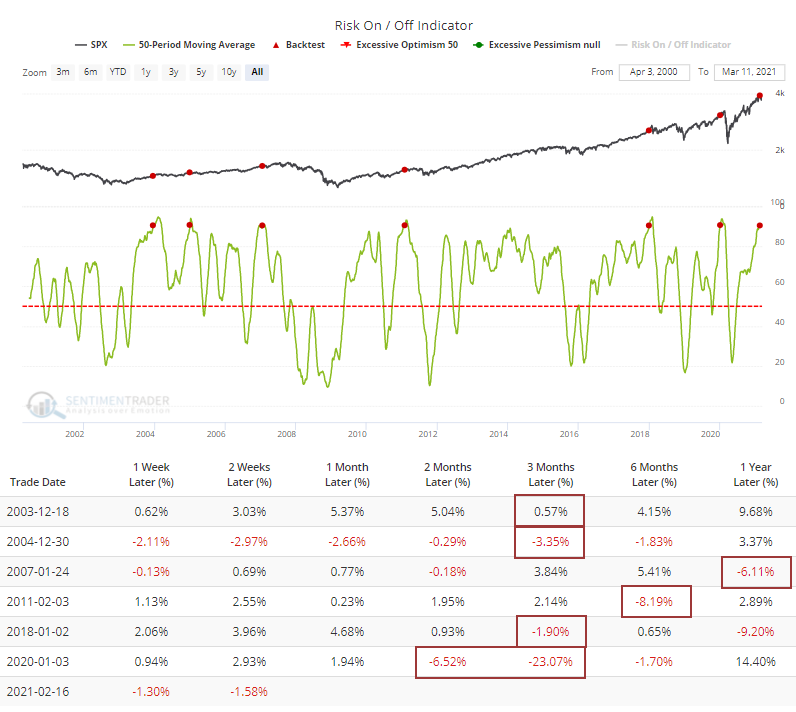
If we only look at the first signal in 3 months, then all of them saw any further short-term gains peter out or turn to an outright negative in the months ahead.

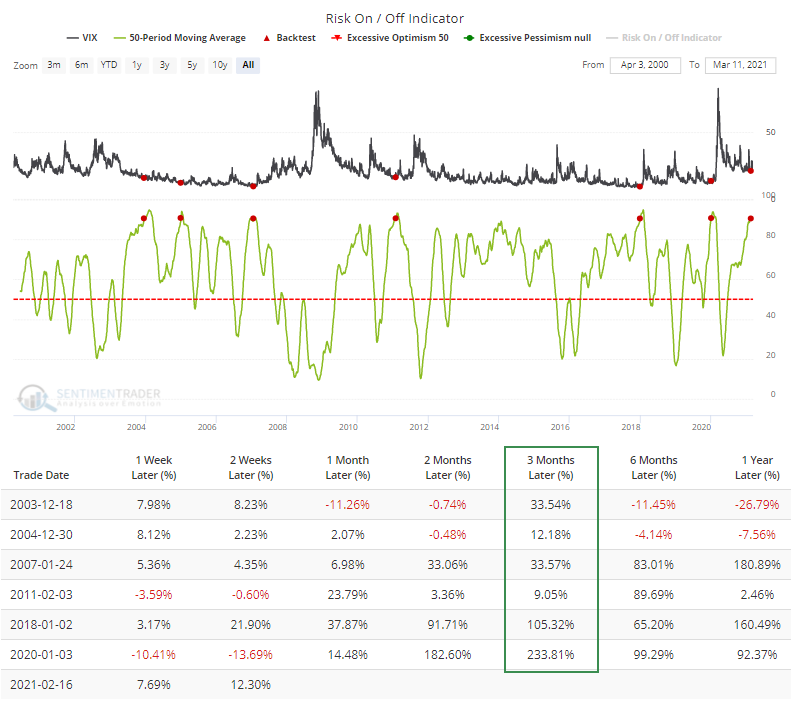
If we substitute the VIX for the S&P in the Backtest Engine, then we can see how much implied volatility or "fear" tended to spike over the next few months. It rose every time, and its average gain was substantial with a median gain of 34% and an average of 71%. This one is perhaps different in that it's triggering from a higher level.

We're still not seeing some of the divergent internal breadth deterioration that often triggers after true extremes in sentiment. For the most part, other than some odd days here and there, the indexes are still showing internal strength. It would be unusual, though not unprecedented, to see a sharp and prolonged downturn given those conditions.

The biggest problem is simply that things have been so good for so long, and investors have grown so comfortable, that forward returns have consistently been weak and extremely unlikely to be sustained.

Sorry, you don't have access to this report

Upgrade your subscription plan to get access
Go to Dasboard
DATA &
TECHnologies
IndicatorEdge
‍
BackTestEdge
‍
Other Tools
‍
DataEdge API
RESEARCH
reports
Research Solution
‍
Reports Library
‍
actionable
Strategies
Trading Strategies
‍
Smart Stock Scanner
‍
FREE
RESOUrCES
Simple Backtest
Calculator
Simple Seasonality
Calculator
The Kelly Criterion
Calculator
Sentiment Geo Map
‍
Public Research Reports
‍
Free Webinar
COMPANY
‍
About
‍
Meet our Team
‍
In the News
‍
Testimonials
‍
Client Success Stories
Pricing
Bundle pricing
‍
Announcements
‍
FAQ
© 2024 Sundial Capital Research Inc. All rights reserved.
Setsail Marketing
TermsPrivacyAffiliate Program
Risk Disclosure: Futures and forex trading contains substantial risk and is not for every investor. An investor could potentially lose all or more than the initial investment. Risk capital is money that can be lost without jeopardizing ones’ financial security or life style. Only risk capital should be used for trading and only those with sufficient risk capital should consider trading. Past performance is not necessarily indicative of future results.

Hypothetical Performance Disclosure: Hypothetical performance results have many inherent limitations, some of which are described below. No representation is being made that any account will or is likely to achieve profits or losses similar to those shown; in fact, there are frequently sharp differences between hypothetical performance results and the actual results subsequently achieved by any particular trading program. One of the limitations of hypothetical performance results is that they are generally prepared with the benefit of hindsight. In addition, hypothetical trading does not involve financial risk, and no hypothetical trading record can completely account for the impact of financial risk of actual trading. for example, the ability to withstand losses or to adhere to a particular trading program in spite of trading losses are material points which can also adversely affect actual trading results. There are numerous other factors related to the markets in general or to the implementation of any specific trading program which cannot be fully accounted for in the preparation of hypothetical performance results and all which can adversely affect trading results.

Testimonial Disclosure: Testimonials appearing on this website may not be representative of other clients or customers and is not a guarantee of future performance or success.