Products
SentimenTrader Trading Tools
‍
Backtest Engine
My Trading Toolkit
Correlation Analysis
Seasonality
Market Prediction
Indicators & Data API
‍
Proprietary Indicators & Charts
Market Data API
Strategies & Scanner
‍
50+ Trading Strategies
Smart Stock Scanner
Smart Option Scanner
Research Reports
‍
Research Solutions
Reports Library
Free Resources
Simple Backtest Calculator
Simple Seasonality Calculator
The Kelly Criterion Calculator
Sentiment Geo Map
Public Research Reports
Education
Sentiment Indicators
Technical Indicators
Pricing
Company
About
In the News
Testimonials
Client Success Stories
Contact
Log inLoginSign up
< BACK TO ALL REPORTS

Risk Appetite Index Buy Signal Concept

Dean Christians
2021-02-23
How one can use the Sentimentrader.com Risk Appetite Index to identify the potential for a risk-on environment.

In a note last week, I discussed how I created a risk-off signal using the Sentimentrader.com Risk Appetite Index. I want to share how I used the same Index to develop a risk-on signal in today's article.

Buy Signal Concept

When I design a buy signal, I like to use two basic techniques to ensure that I never catch a falling knife. The first is a momentum condition for the Index. I accomplish this by incorporating a positive rate of change or a range rank cross above condition. The second method requires an improvement in the model indicator. I use an increment amount condition to accomplish this task. The risk appetite signal in today's report utilizes the increment amount technique.

Risk Appetite Index Risk-On Buy Signal

The risk-on signal seeks to identify instances in history when the risk appetite Index has fallen below a user-defined threshold and increases from the subsequent low by an increment amount. The model will issue an alert based upon the following conditions. 

Signal Criteria

Condition1 = Risk Appetite Index crosses below 0.0501

Condition2 = Risk Appetite Index increases by 0.05 from the subsequent low below the threshold level.

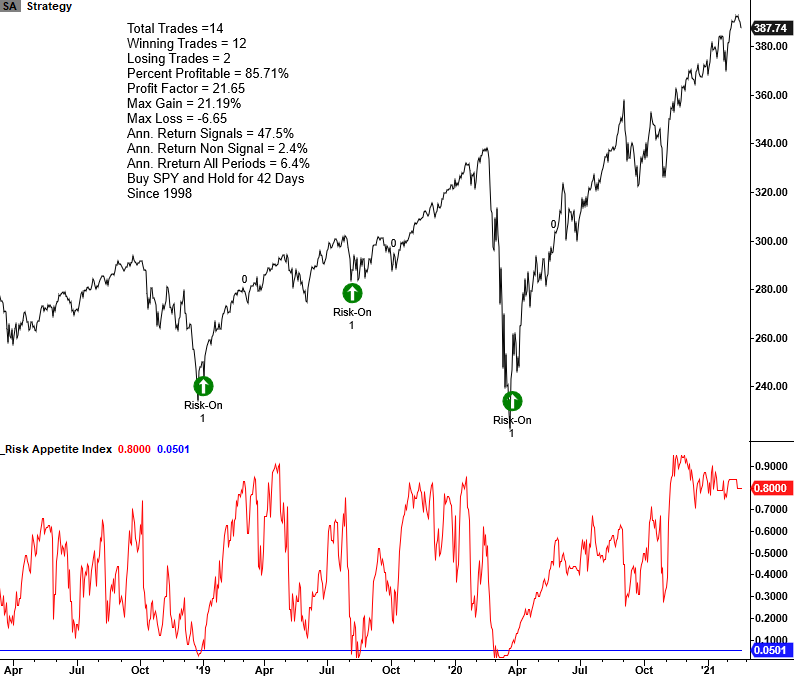
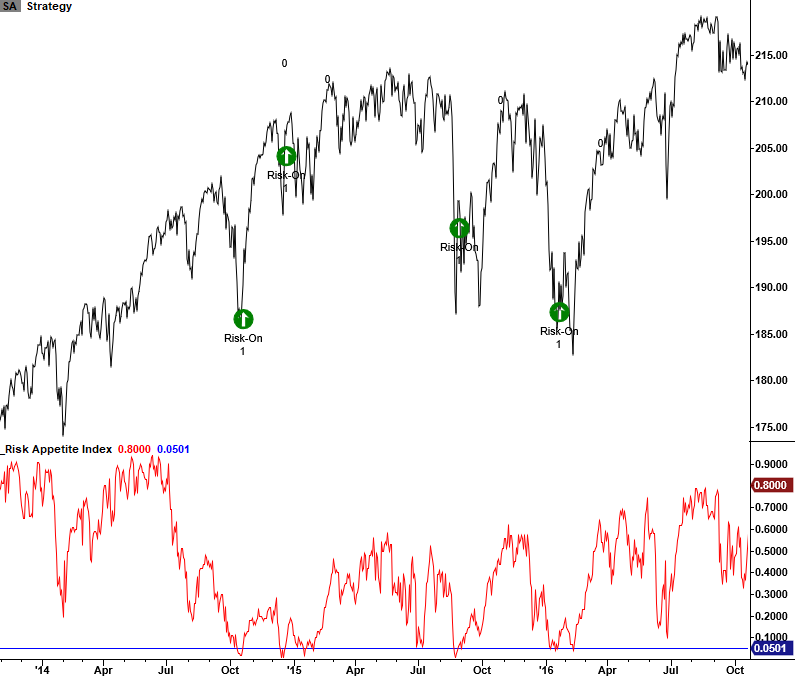
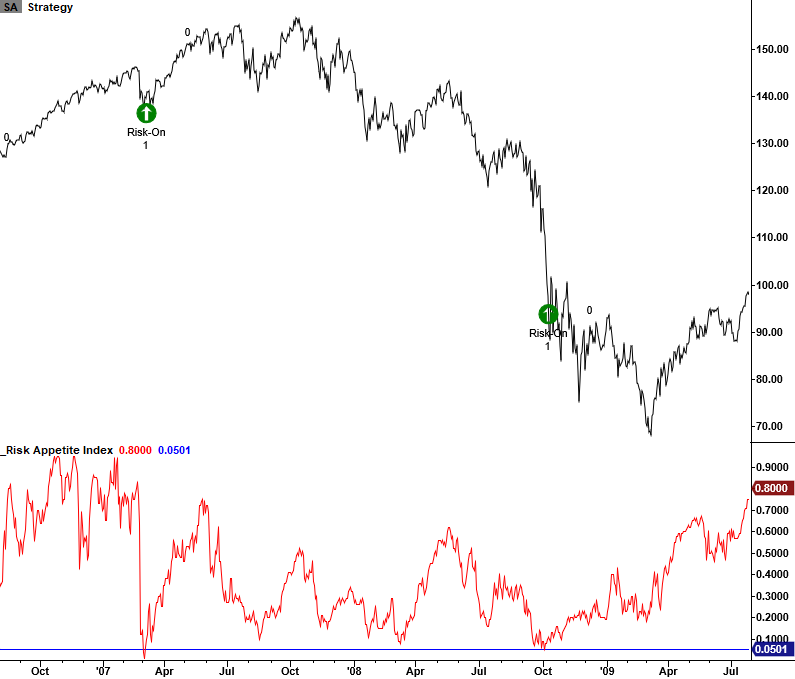
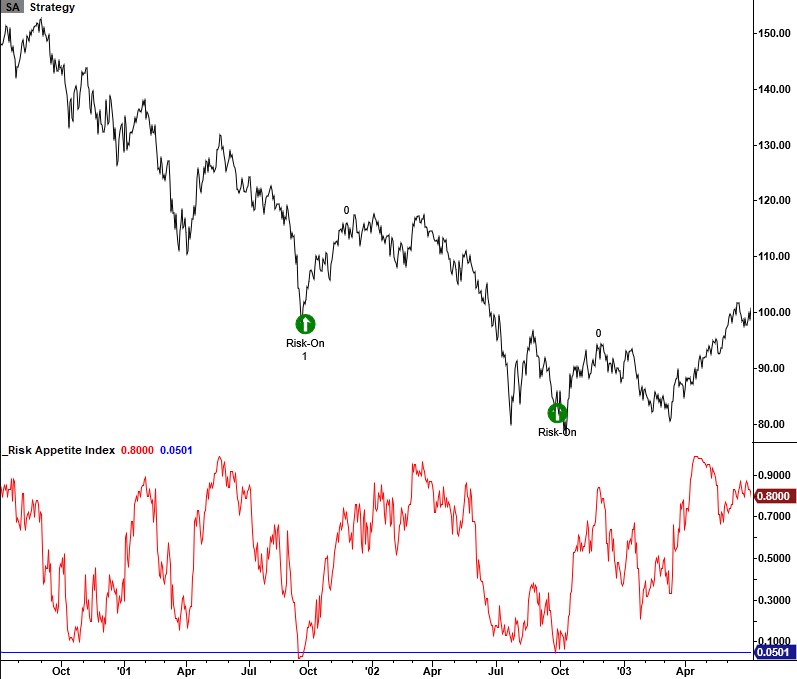
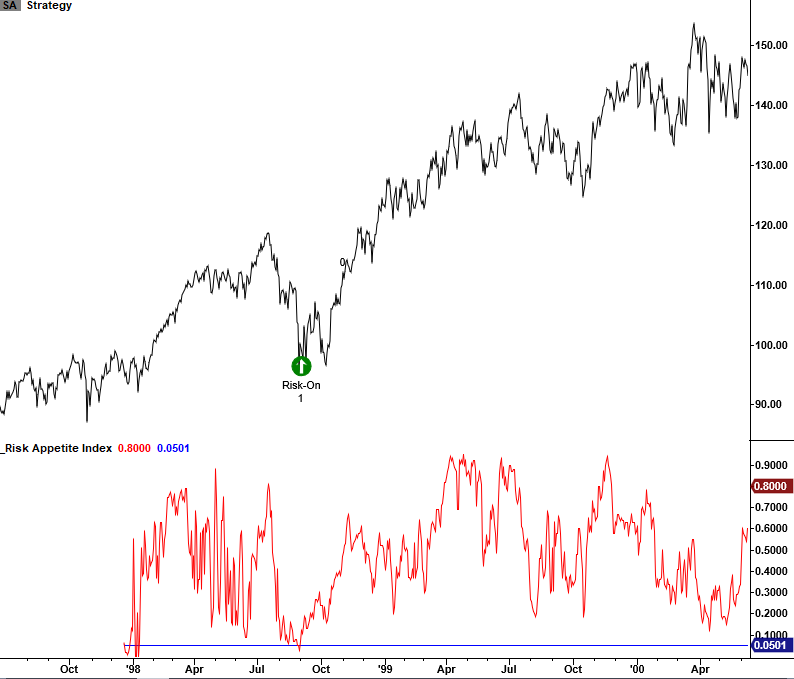
Let's take a look at some historical chart examples and the signal performance.

Please note the blue horizontal line in the risk appetite index sub-graph as you review the historical chart examples. The line represents the signal threshold level. 

Risk Appetite Signal Example

Risk Appetite Signal Example

Risk Appetite Signal Example

Risk Appetite Signal Example

Risk Appetite Signal Example

Risk Appetite Signal Performance

The risk appetite risk-on buy signal exhibits strong results in the 8-52 week timeframe.

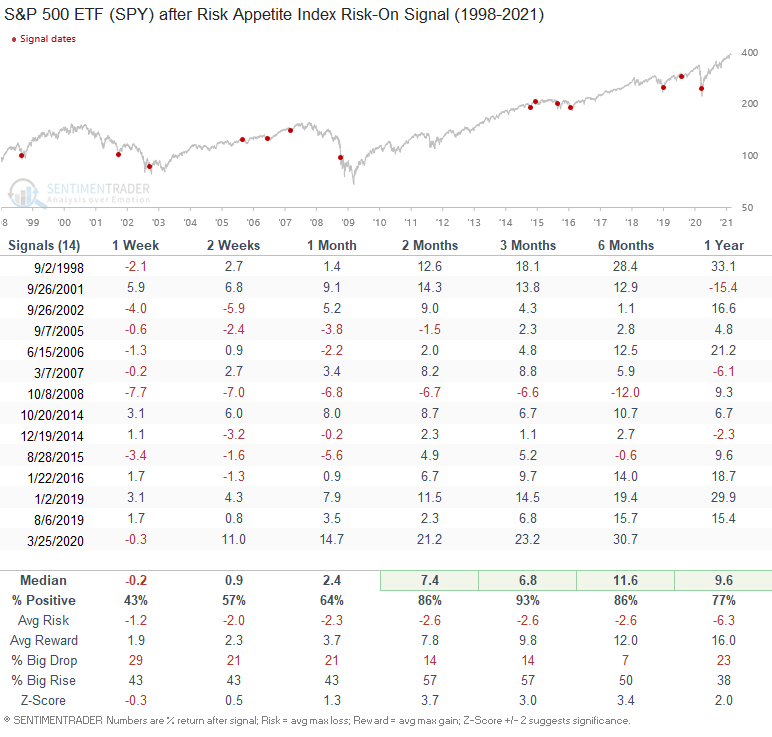
Conclusion: The Risk Appetite Index signal provides an excellent risk/reward profile. However, because the index history is limited and the data updates are not timely, I would use the model to confirm other bullish for the market signals.  

PRODUCTS
SentimenTrader
Trading Tools
Indicators & Data API
‍
Strategies & Scanner
‍
Research Reports
FREE
RESOUrCES
Simple Backtest
Calculator
Simple Seasonality
Calculator
The Kelly Criterion
Calculator
Sentiment Geo Map
‍
Public Research Reports
‍
Education
Sentiment Indicators
‍
Technical Indicators
‍
Pricing
Bundle pricing
‍
FAQ
‍
Announcements
‍
COMPANY
‍
About
‍
In the News
‍
Testimonials
‍
Client Success Stories
CONTACT
‍
General Inquiries
‍
Media Inquiries
‍
Financial Professionals Inquiries
‍
© 2026 Sundial Capital Research Inc. All rights reserved.
Setsail Marketing
TermsPrivacyAffiliate Program
Risk Disclosure: The information and tools provided are for research and analytical purposes only and are not intended as investment advice. Market analysis involves uncertainty, and outcomes may differ from expectations. Users should conduct their own due diligence and consider their individual circumstances before making any financial decisions. Past performance is not necessarily indicative of future results.

Hypothetical Performance Disclosure: Hypothetical performance results have many inherent limitations, some of which are described below. No representation is being made that any account will or is likely to achieve profits or losses similar to those shown; in fact, there are frequently sharp differences between hypothetical performance results and the actual results subsequently achieved by any particular trading program. One of the limitations of hypothetical performance results is that they are generally prepared with the benefit of hindsight. In addition, hypothetical trading does not involve financial risk, and no hypothetical trading record can completely account for the impact of financial risk of actual trading. for example, the ability to withstand losses or to adhere to a particular trading program in spite of trading losses are material points which can also adversely affect actual trading results. There are numerous other factors related to the markets in general or to the implementation of any specific trading program which cannot be fully accounted for in the preparation of hypothetical performance results and all which can adversely affect trading results.

Testimonial Disclosure: Testimonials appearing on this website may not be representative of other clients or customers and is not a guarantee of future performance or success.