
Risk Appetite and Industry Indexes flash continuation signals

Key points
- Despite ongoing short-term weakness, individual objective indicators continue to flash favorable signals for the stock market
- The Risk Appetite Index has flashed a series of favorable continuation signals recently
- The Industry % Indexes in Bear Market indicator suggests an oversold condition in an established uptrend - which typically plays out to the upside more often than not
The market continues to consolidate; trend continuation indicators remain favorable
The major market indexes peaked in late July and have been consolidating ever since. As always, the longer the market consolidates and the greater the magnitude of the decline, the louder the din of those expressing concern about the market's prospects going forward. Given rising interest rates, rising debt levels, and an inverted yield curve - to name a few of the top worries - it is not unreasonable to be concerned about the ability of the market to reverse back to the upside.
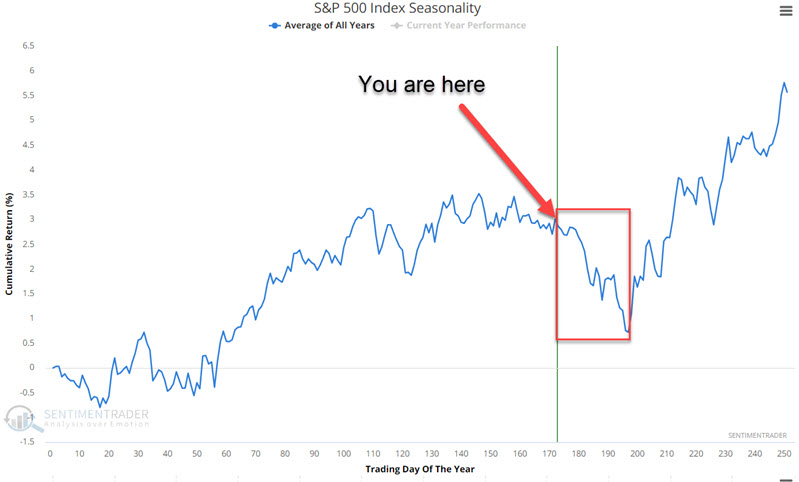
In addition, stock market seasonality is entering its most unfavorable period of the year.
The bottom line: There are reasons why the market could continue to struggle in the near term. We ultimately try to rely on the larger message from typically reliable indicators regarding the longer-term picture. So far, there has been enough favorable action to remain optimistic that the recent weakness is part of a correction and not the beginning of a long-term bear market. See here, here, here, and here.
Let's consider two more recent signals - one of which is a repeat from one of the articles linked above.
Risk Appetite Index flashes favorable trend continuation signal
A handful of firms have introduced various measures of risk appetite, which tend to look at market behavior like credit spreads, equity and foreign exchange volatility, gold prices, and sector relative performance (such as between defensive sectors like utilities and economically sensitive sectors like financials).
We combined three of them and normalized them into a single index. They include Citigroup Macro Risk Index, Westpac Risk Aversion Index, and UBS G10 Carry Risk Index Plus. As the index rises, it means that investors are becoming more and more risk-seeking. In a longer-term bullish trend, a high reading for the Risk Appetite Index can serve as a helpful trend confirmation tool (remember, more bulls and more buying are needed to sustain a bull market).
The chart and table below display S&P 500 results after the Risk Appetite Index was above 0.95 while the S&P 500 Index was above its 200-week moving average.
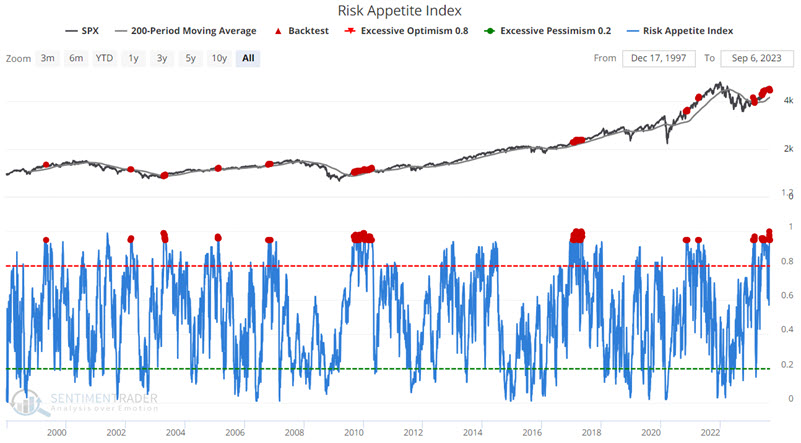
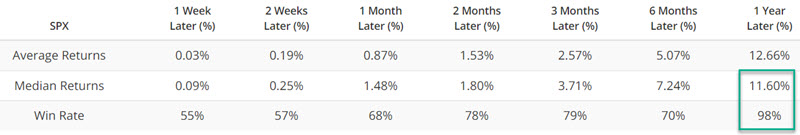
For the test period from 1997 to today, the median 1-year return for the S&P 500 Index for ALL DAYS is +9.93% with a Win Rate of 74%. Following the abovementioned signal from the Risk Appetite Index, the median 1-year return jumps to 11.60%, and the Win Rate soars to 98%. As always, this does not guarantee higher prices a year from now. But it does add significant weight to the bullish side of the ledger.
Industry % Indexes in Bear Market flashing more green
Our Industry % Indexes in Bear Market indicator shows the percentage of 23 industries that are trading more than 20% below their 52-week highs. The signal detailed below was recently highlighted previously in this article dated 2023-08-22.
The chart and table below highlight the S&P 500 Index performance after the indicator crosses above 10%.
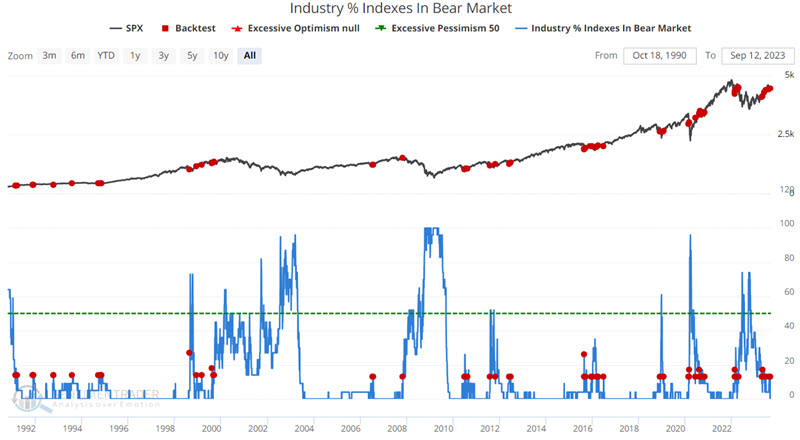

The S&P 500 Index has historically generated above-average Win Rates, particularly for 3-month, 6-month, and 1-year periods, as well as robust Median Returns. This is somewhat counterintuitive as a rising value for this indicator implies that more industries are performing poorly - and an increasing value ultimately precedes every bear market. That said, we have also found that far more often than not, crosses above 10% mark a routine pullback in a bull market and not necessarily the start of a new bear market.
What the research tells us…
There is reason for concern in the near term. Regardless of any prognostications one way or the other, the primary task for investors at this juncture is to follow their own risk management rules. Investors who wish to hedge against a worst-case scenario might consider a hedging strategy using options (examples here). Beyond that, the other critical task for longer-term investors is avoiding panicking and continuing to focus on the longer-term trend. Indicators such as the ones highlighted above suggest the potential for higher stock prices in the year ahead.