
Reversal Day As A Bottoming Signal

After what looked like an ugly morning, with stocks breaking down to multi-month lows, enough buying pressure has come in to push indexes like the S&P 500 above their opening prices, carving out a reversal day (so far).
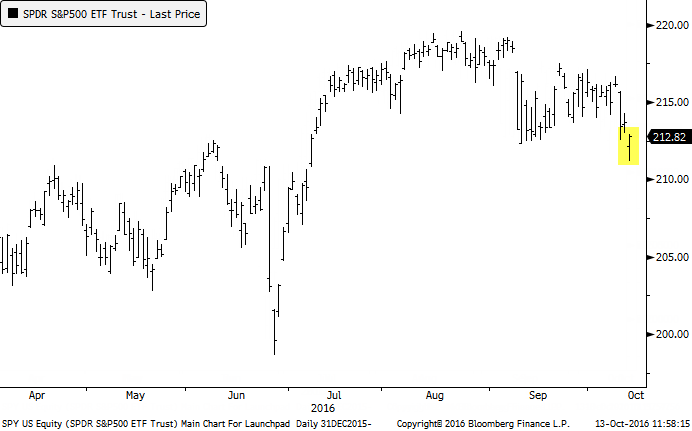
We've looked at reversal days many times in the past, with the conclusion that they are inconsistent predictors in and of themselves. Thursday's reversal isn't showing anything particularly notable other than the price action - for example, volume isn't outstanding, there was not widespread pessimism, etc.
Let's go back to the inception of the most popular ETF in the world, SPY, and look for other times that it:
- Opened down at least 0.5%
- Sunk to a 3-month low
- Reversed enough to close above its open
Here is how it performed going forward:
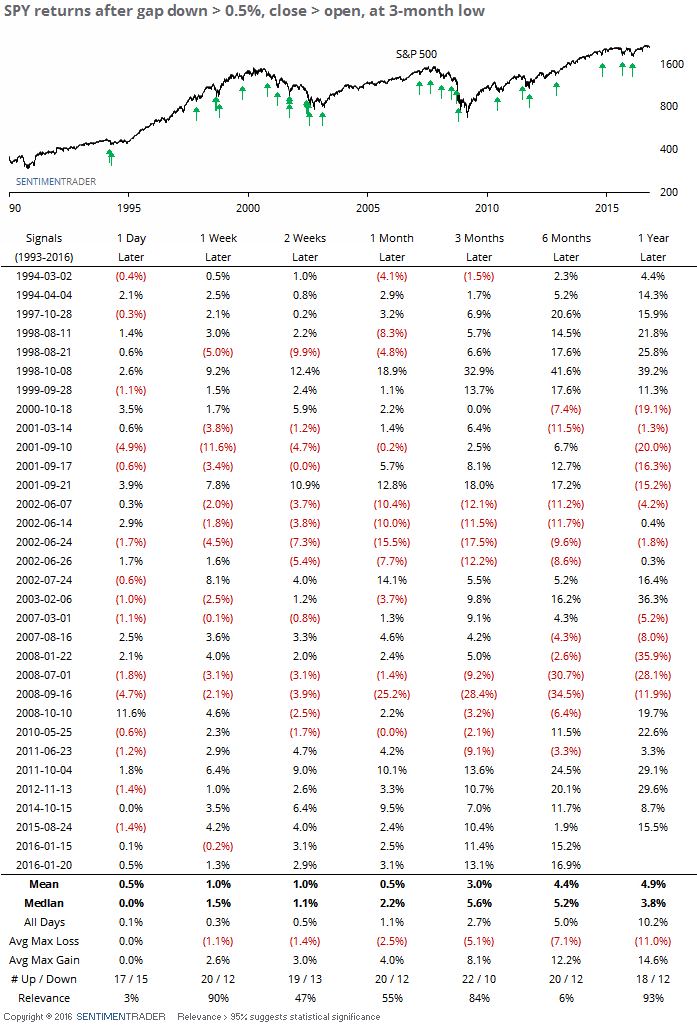
Its most impressive returns were in the shorter-term. It tended to snap back over the next week about twice as often as it declined, its average return was impressive compared to random, and its risk/reward was more than 2-to-1 to the upside. Since 2010, the reversals were excellent buy signal.
If we filter the table for times when SPY was trading above its 200-day average, we see that this is unusual, with only 6 occurrences.
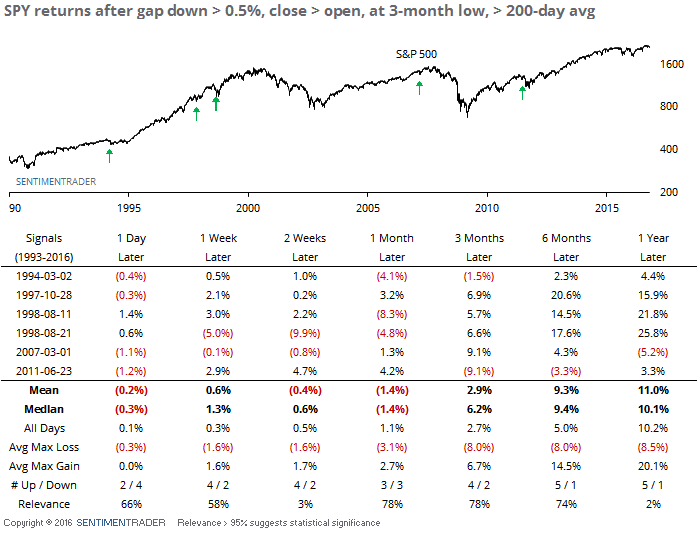
It did not necessarily improve the future returns, in fact they degraded quite a bit. Every one of them ended up making a lower low, so none of them proved to be good medium-term entry points.
These reversals look great on a chart and get technicians all worked up. But they have a relatively high failure rate, and as noted above, when occurring in uptrending markets, have ultimately led to a lower low every time (though the sample size is small). We'll have to see how the rest of the day sorts out but based on the action so far, the reversal doesn't look like a solid all-clear sign.