Products
SentimenTrader Trading Tools
‍
Backtest Engine
My Trading Toolkit
Correlation Analysis
Seasonality
Market Prediction
Indicators & Data API
‍
Proprietary Indicators & Charts
Market Data API
Strategies & Scanner
‍
50+ Trading Strategies
Smart Stock Scanner
Smart Option Scanner
Research Reports
‍
Research Solutions
Reports Library
Free Resources
Simple Backtest Calculator
Simple Seasonality Calculator
The Kelly Criterion Calculator
Sentiment Geo Map
Public Research Reports
Education
Sentiment Indicators
Technical Indicators
Pricing
Company
About
In the News
Testimonials
Client Success Stories
Contact
Log inLoginSign up
< BACK TO ALL REPORTS

Relative Ratio Rank Risk-On Update

Dean Christians
2021-02-17

In today's note, I want to provide an update on the relative strength ratio rank risk-on composite model and take a look at a few other ratio relationships I'm monitoring. Please see my note from 1/19/21 to learn more about how I designed the model.

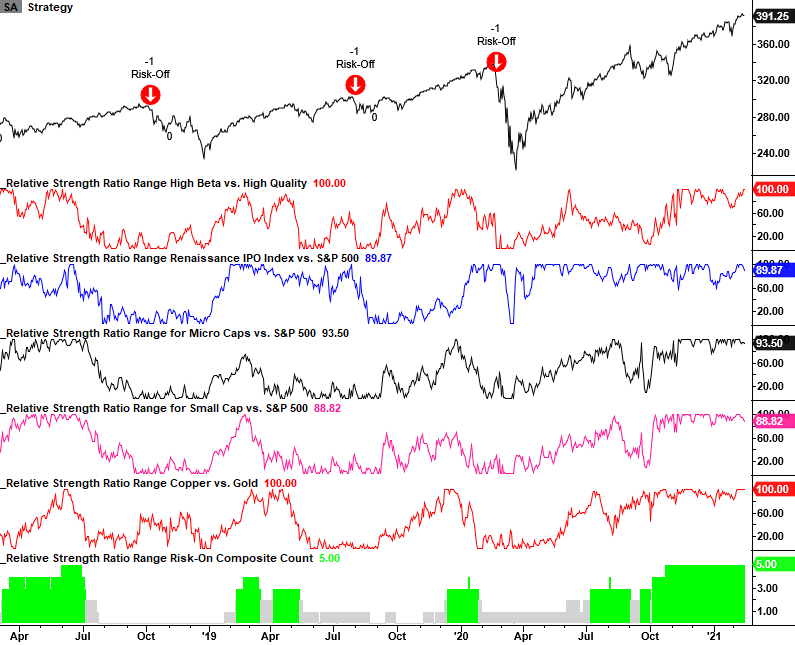
Relative Ratio Rank Risk-Off Model

The relative strength ratio rank risk-on model remains in a firm position with a composite count of five and all components in the 88th percentile or higher. Remember, the model will trigger a risk-off signal when the count falls to one or less, and the S&P 500 turns down. Please note, in the late January market dip, only one component fell below the 75th percentile. Risk appetite remains firm.


Relative Ratio Rank Risk-On Update


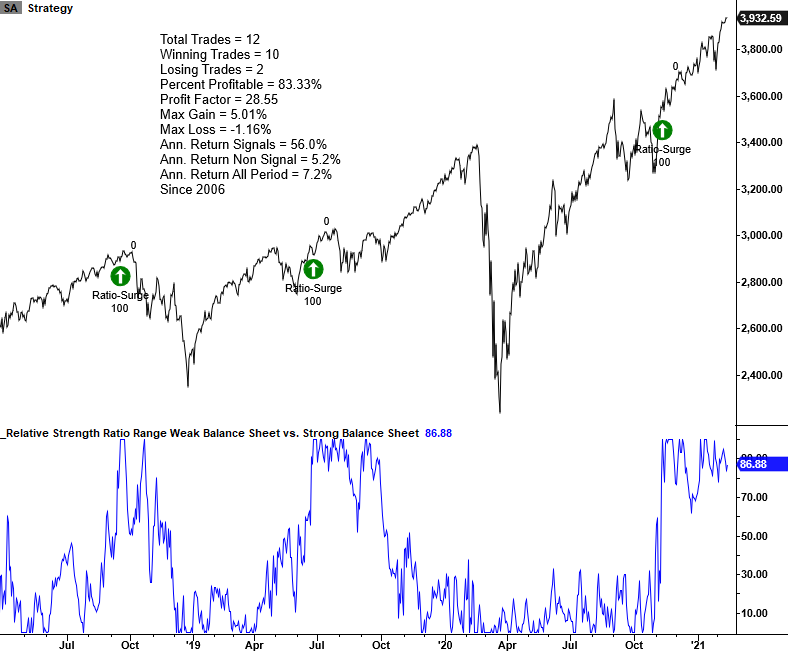
Weak Balance Sheet versus Strong Balance Sheet

Weak balance sheet stocks continue to outperform strong balance sheet stocks with a range rank above the 86th percentile.

Relative Ratio Rank Risk-On Update


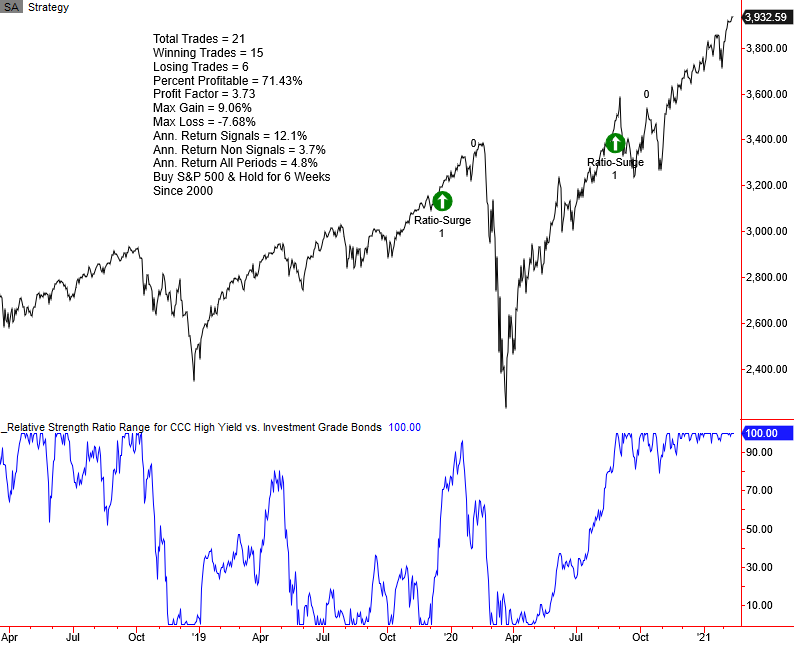
CCC High Yield versus Investment Grade Bonds

CCC high yield bonds continue to outperform investment-grade bonds with a range rank in the 100th percentile. Please note, the underperformance in IG bonds of late has been due to rising rates.

Relative Ratio Rank Risk-On Update


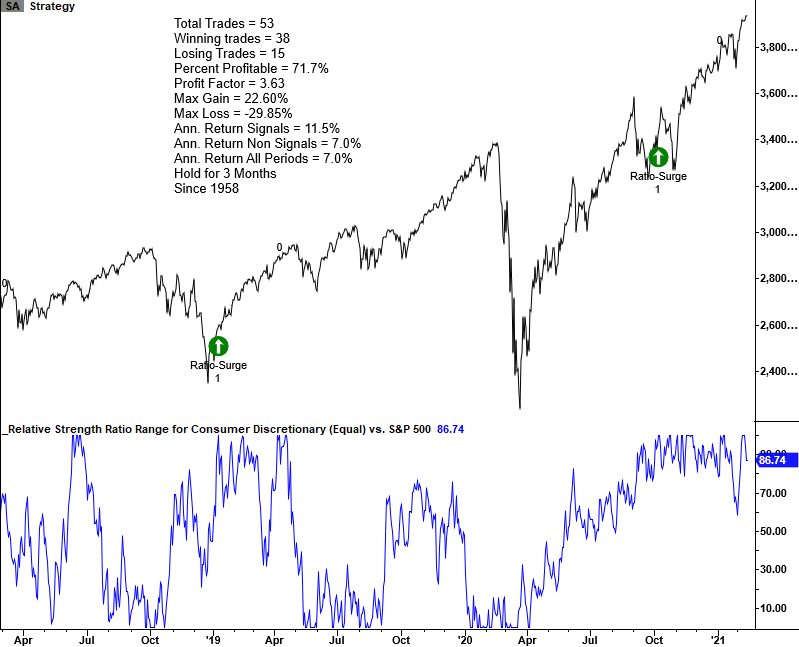
Consumer Discretionary Equal-Weighted versus S&P 500

The Consumer Discretionary (equal-weighted) sector continues to outperform S&P 500 Index with a range rank above the 86th percentile. I prefer the equal-weighted sector over the cap-weighted one as it neutralizes a stock like Amazon.

Relative Ratio Rank Risk-On Update


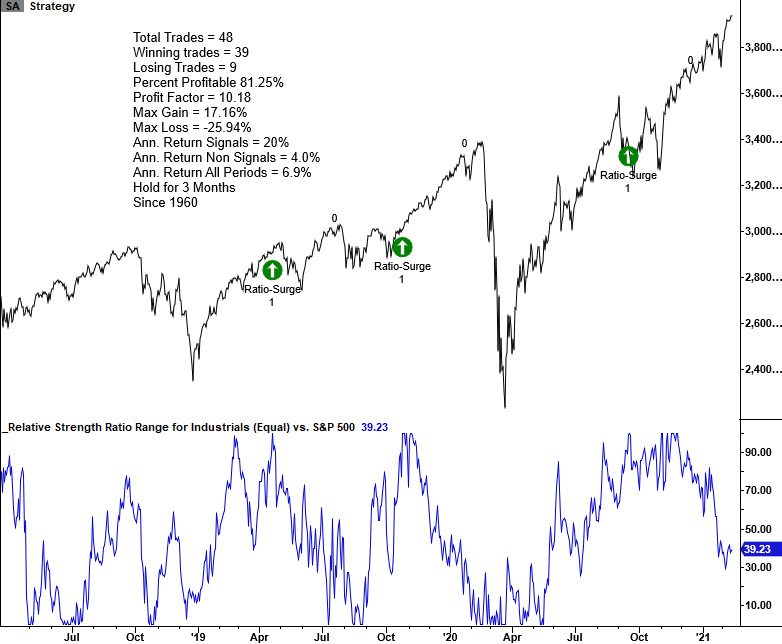
Industrials Equal-Weighted versus S&P 500

The Industrials (equal-weighted) sector range rank versus the S&P 500 Index has turned down considerably. The rank currently resides in the 39th percentile.

Relative Ratio Rank Risk-On Update


PRODUCTS
SentimenTrader
Trading Tools
Indicators & Data API
‍
Strategies & Scanner
‍
Research Reports
FREE
RESOUrCES
Simple Backtest
Calculator
Simple Seasonality
Calculator
The Kelly Criterion
Calculator
Sentiment Geo Map
‍
Public Research Reports
‍
Education
Sentiment Indicators
‍
Technical Indicators
‍
Pricing
Bundle pricing
‍
FAQ
‍
Announcements
‍
COMPANY
‍
About
‍
In the News
‍
Testimonials
‍
Client Success Stories
CONTACT
‍
General Inquiries
‍
Media Inquiries
‍
Financial Professionals Inquiries
‍
© 2026 Sundial Capital Research Inc. All rights reserved.
Setsail Marketing
TermsPrivacyAffiliate Program
Risk Disclosure: The information and tools provided are for research and analytical purposes only and are not intended as investment advice. Market analysis involves uncertainty, and outcomes may differ from expectations. Users should conduct their own due diligence and consider their individual circumstances before making any financial decisions. Past performance is not necessarily indicative of future results.

Hypothetical Performance Disclosure: Hypothetical performance results have many inherent limitations, some of which are described below. No representation is being made that any account will or is likely to achieve profits or losses similar to those shown; in fact, there are frequently sharp differences between hypothetical performance results and the actual results subsequently achieved by any particular trading program. One of the limitations of hypothetical performance results is that they are generally prepared with the benefit of hindsight. In addition, hypothetical trading does not involve financial risk, and no hypothetical trading record can completely account for the impact of financial risk of actual trading. for example, the ability to withstand losses or to adhere to a particular trading program in spite of trading losses are material points which can also adversely affect actual trading results. There are numerous other factors related to the markets in general or to the implementation of any specific trading program which cannot be fully accounted for in the preparation of hypothetical performance results and all which can adversely affect trading results.

Testimonial Disclosure: Testimonials appearing on this website may not be representative of other clients or customers and is not a guarantee of future performance or success.